
A Step-By-Step Walk Through The Beer Distribution Game
An overview of the first 8 weeks of the game, the dashboard and the key performance indicators

Oliver Grasl
Sunday, September 18, 2022
Become part of a supply chain that delivers beer from a brewery via a distributor, a wholesaler, and a retailer to the end consumer. Your challenge is to ensure that the consumers' demand for beer is satisfied by managing your part of the supply chain. Play either in single player mode or – much more fun – in multiplayer mode with your friends.
The Beer Distribution Game is seemingly simple – after all, all you need to do is order beer.
But most likely you were overwhelmed by the amount of information you had to process, especially when you played the game for the first time – it certainly still happens to me, and I have been involved in the Beer Game for close to 10 years now.
On the one hand, this is one of the key takeaways from the Beer Distribution Game: how easy it is to get lost in data even in conceptually simple systems.
On the other hand, it is nevertheless important to ensure that all players really understand the data that is being presented.
This is especially true if you are a facilitator playing the game with a whole group of players.
So to make sure you can concentrate on making the right ordering decision each week, I would like to invite you to walk through the first eight weeks of the game with me.
In doing so, we will take a close look at the game dashboard and the key performance indicators it displays.
We will also learn how to use the order history.
By the end of this post, you will really understand what is going on and how the numbers come about.

Before we get started, let me recap the rules of the game:
The overall objective of the Beer Distribution Game is to manage a supply chain that delivers
beer from a brewery, via a distributor, wholesaler, and retailer to the end consumers.
Your target is to fulfill your customers' demand for beer while keeping your own costs low
and also the cost of the entire supply chain low. You should also ensure that you keep
stocked up so that you can deal with future fluctuations in demand.
If you play the single player version of our Beer Game, you take on the role of the retailer and
the other roles are filled by artificial players – the artificial players are played by the computer, and they implement a deterministic, “smart” ordering algorithm.
Having deterministic players ensures you can play the game again and again, and the other
players will always behave the same way. The fact that the artificial players follow a smart
ordering algorithm ensures that you can achieve the game targets.
If you play the multiplayer version of our Beer Game, you can choose which position in the
supply chain you would like to fill. For each of the other positions, you can choose to invite a
friend or colleague, or you can fill it with an artificial player.
Does it make sense to play the multiplayer version of the game alone?
Yes, it does because you can choose which role to play. The retailer is actually the "easiest"
position to play, so I have you need a challenge, try playing one of the other positions.
In our version of the Beer Distribution Game, you can also become the facilitator of a multigame
- a multigame is just a number of games running in parallel. This is useful for classroom training at schools, universities and in corporations.
When I am facilitating a Beer Game, I typically do not play myself because I am fully occupied
monitoring the individual games and ensuring that they run smoothly. This also gives me
the freedom to answer players questions regarding game mechanics and the dashboard if
necessary.
Everything I explain here also applies to the multigame because the multigame is just a
collection of single player or multiplayer games running in parallel.
To make it easier for you to follow me on my walk through the game, I will play the single
player game in the role of the retailer – but because the dashboards are identical for all
roles and all game variants, everything we discuss here applies to the other game variants.

Let us get back to the game objectives: satisfying your customer's demand for beer while
keeping costs low.
We will tackle each part of the objective in turn.
How do you satisfy your customers' demand for beer?
The key point here is that you start with a stock of 400 units of beer, which you can sell to your customers. If you run out of beer, you need to order more beer from your supplier.
Each week, you are likely to receive new deliveries of beer from your supplier (these deliveries are always in fulfillment of your past orders, your supplier will never spontaneously send you beer).
The beer you have in storage and the incoming deliveries together define the maximum amount of beer that you could deliver to your customer.
To make it easier for you, you do not need to worry about deliveries – each week, the system
will try to satisfy the customer's demand by delivering the required amount of beer … but of
course, the system can never deliver more than the maximum amount available.
Any demand for beer that you cannot meet straight away is put on back-order.
The only task you – as a player – have every week is to order enough beer, to ensure that
you keep stocked up with beer to meet future demand.
Now let us look at the second part of the objective: keeping the cost low.
You – and all the other players in the supply chain – generate storage costs for the beer in
your inventory: €0.5 for each unit of beer, with a minimum cost of €200.
So if you order too much beer, you need to store that beer somewhere, which increases
your cost.
On the other hand, you are also penalized €1 for each unit of beer that you have to put on
back-order. Therefore, if you order too little beer, the penalty you pay is even greater.
The total supply chain cost is the sum of each player's individual cost.
Why isn't it enough to just worry about your own cost, why is the overall supply chain cost
so relevant?
This is because if you order an excessive amount of beer, this will create a back-order
with your supplier and perhaps even the supplier’s supplier.
So, even if ordering larger amounts of beer quickly rather than having beer on back-order is
better for you, this is not better for the supply chain overall.
To make the game a little more challenging, it sets concrete targets for costs and inventory:
your own costs should be below €7,800 at the end of the game and the supply chain costs
below €29,300. You also should have a full inventory of 400 units of beer.
With the right playing strategy, you can perform even better than this, so give it a go.
Beginning of Week 1
Now that we know the rules, let us take a look at the dashboard – the picture below shows the
dashboard right at the beginning of the game. It contains the key performance indicators
that measure what happened last week (i.e. in Week 0), as a basis for making an order
decision for the next week (i.e. Week 1):
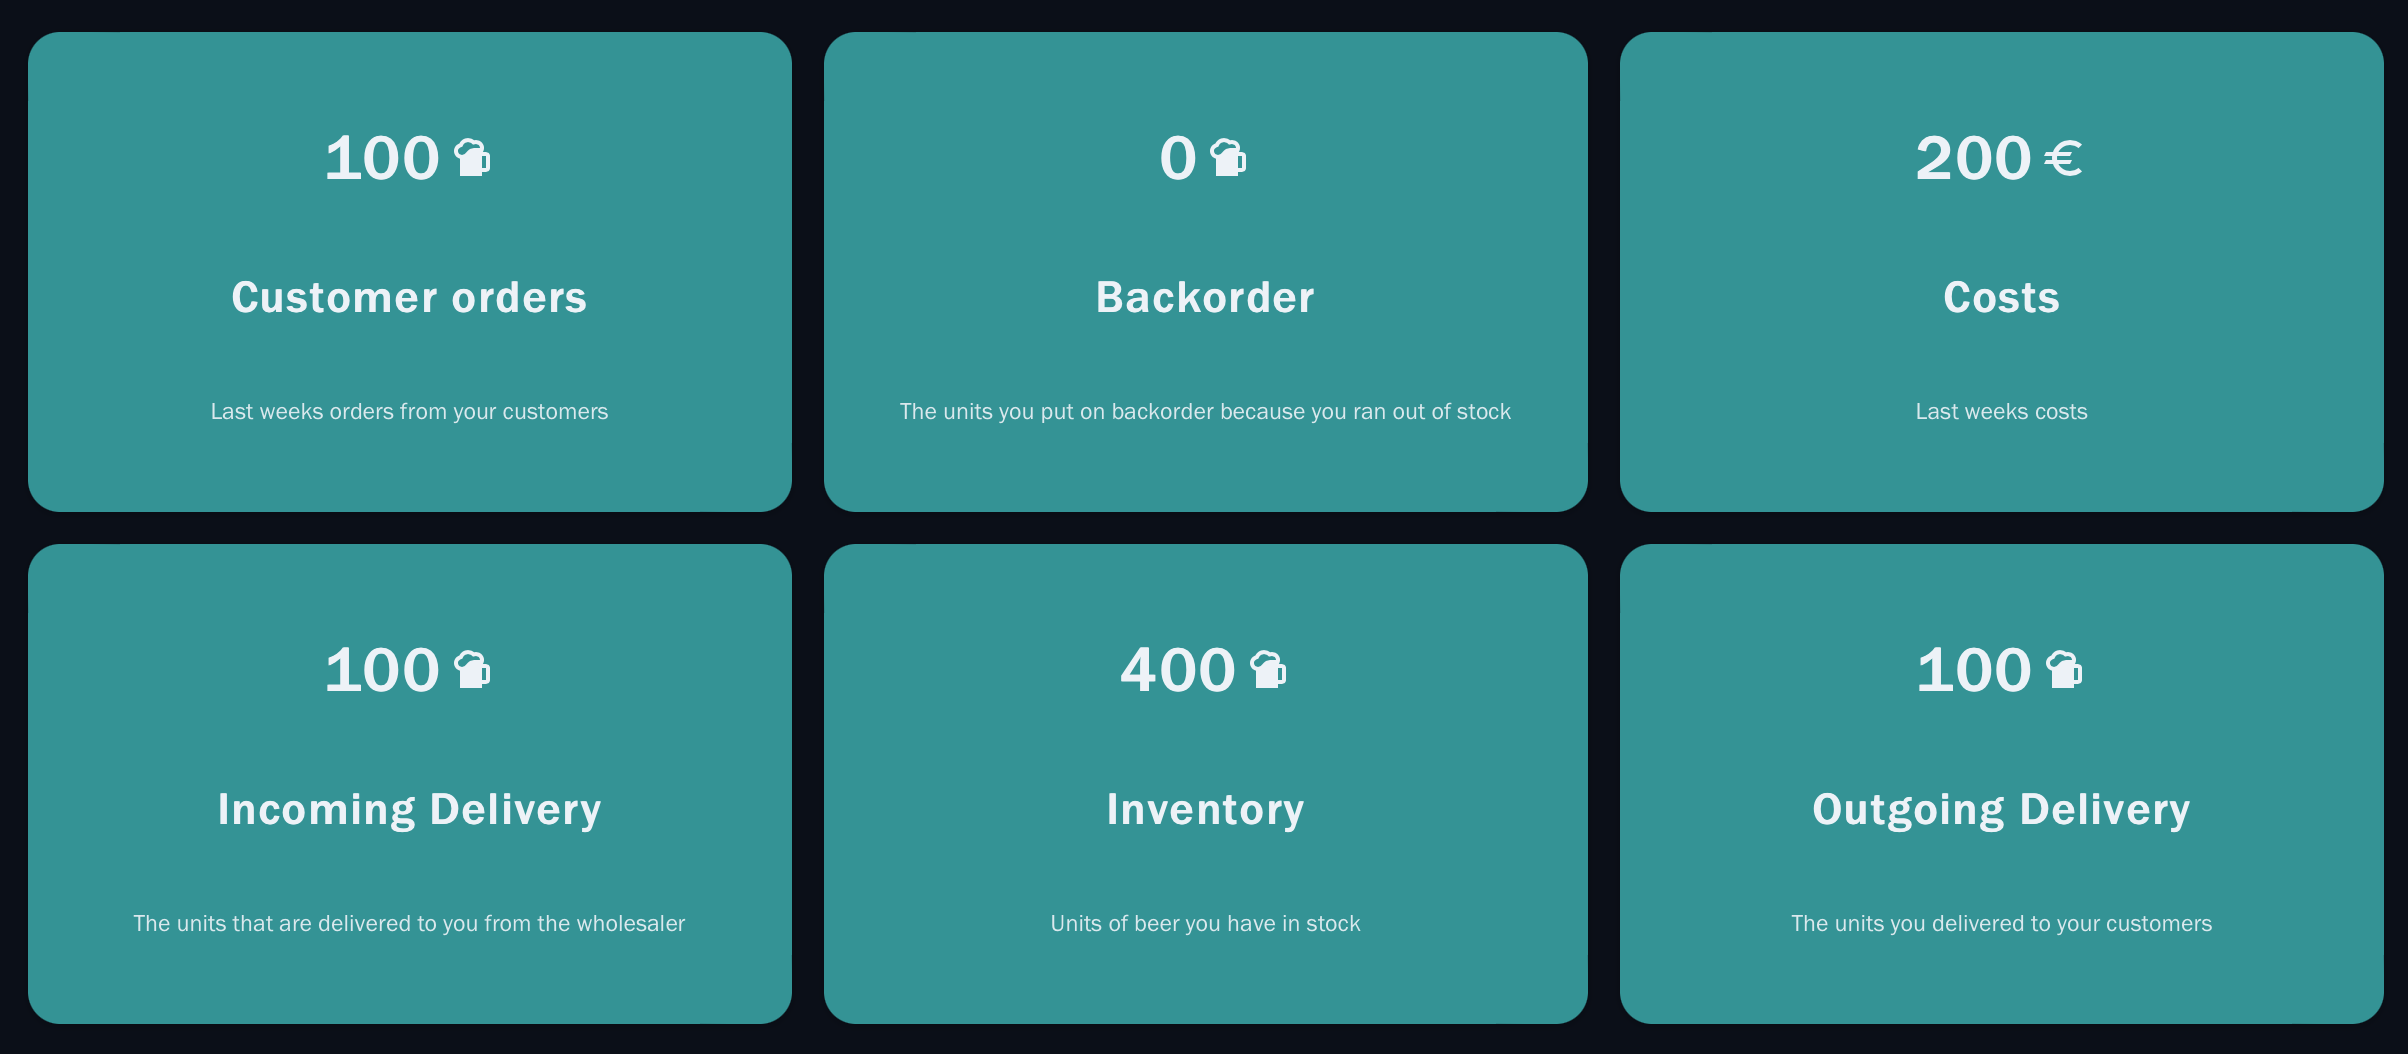
Let us look at each indicator in turn:
- Inventory. The inventory measures the amount of beer you had in stock at the end of last week. At the start of the game, you have an inventory of 400 units.
- Incoming deliveries. This is the amount of beer that was delivered to you from your supplier last. You received 100 units of beer.
- Incoming orders. This is the amount of beer that your customers ordered last week. The customers ordered 100 units.
- Outgoing deliveries. This is the amount of beer you delivered last week - 100 units.
- Back-order. The amount of beer that your customers ordered in the past but which you have not delivered yet because you were out of stock. You start with a back-order of 0 units. Remember: having beer on back-order cost you €1 per unit of beer per week.
- Cost. The sum of last week's inventory cost and back-order costs (calculated based on the inventory and back-order at the beginning of last week). The inventory at the beginning of last week must have been 400, which leads to an inventory cost of €200 (€0.5 per unit).
It is important to understand that the dashboard shows a summary of what went on last
week, and that you are making an order at the end of that week for the next week.
Given that the customer ordered 100 units, we are fully stocked, and we have zero back-order,
we decide to order 100 units.
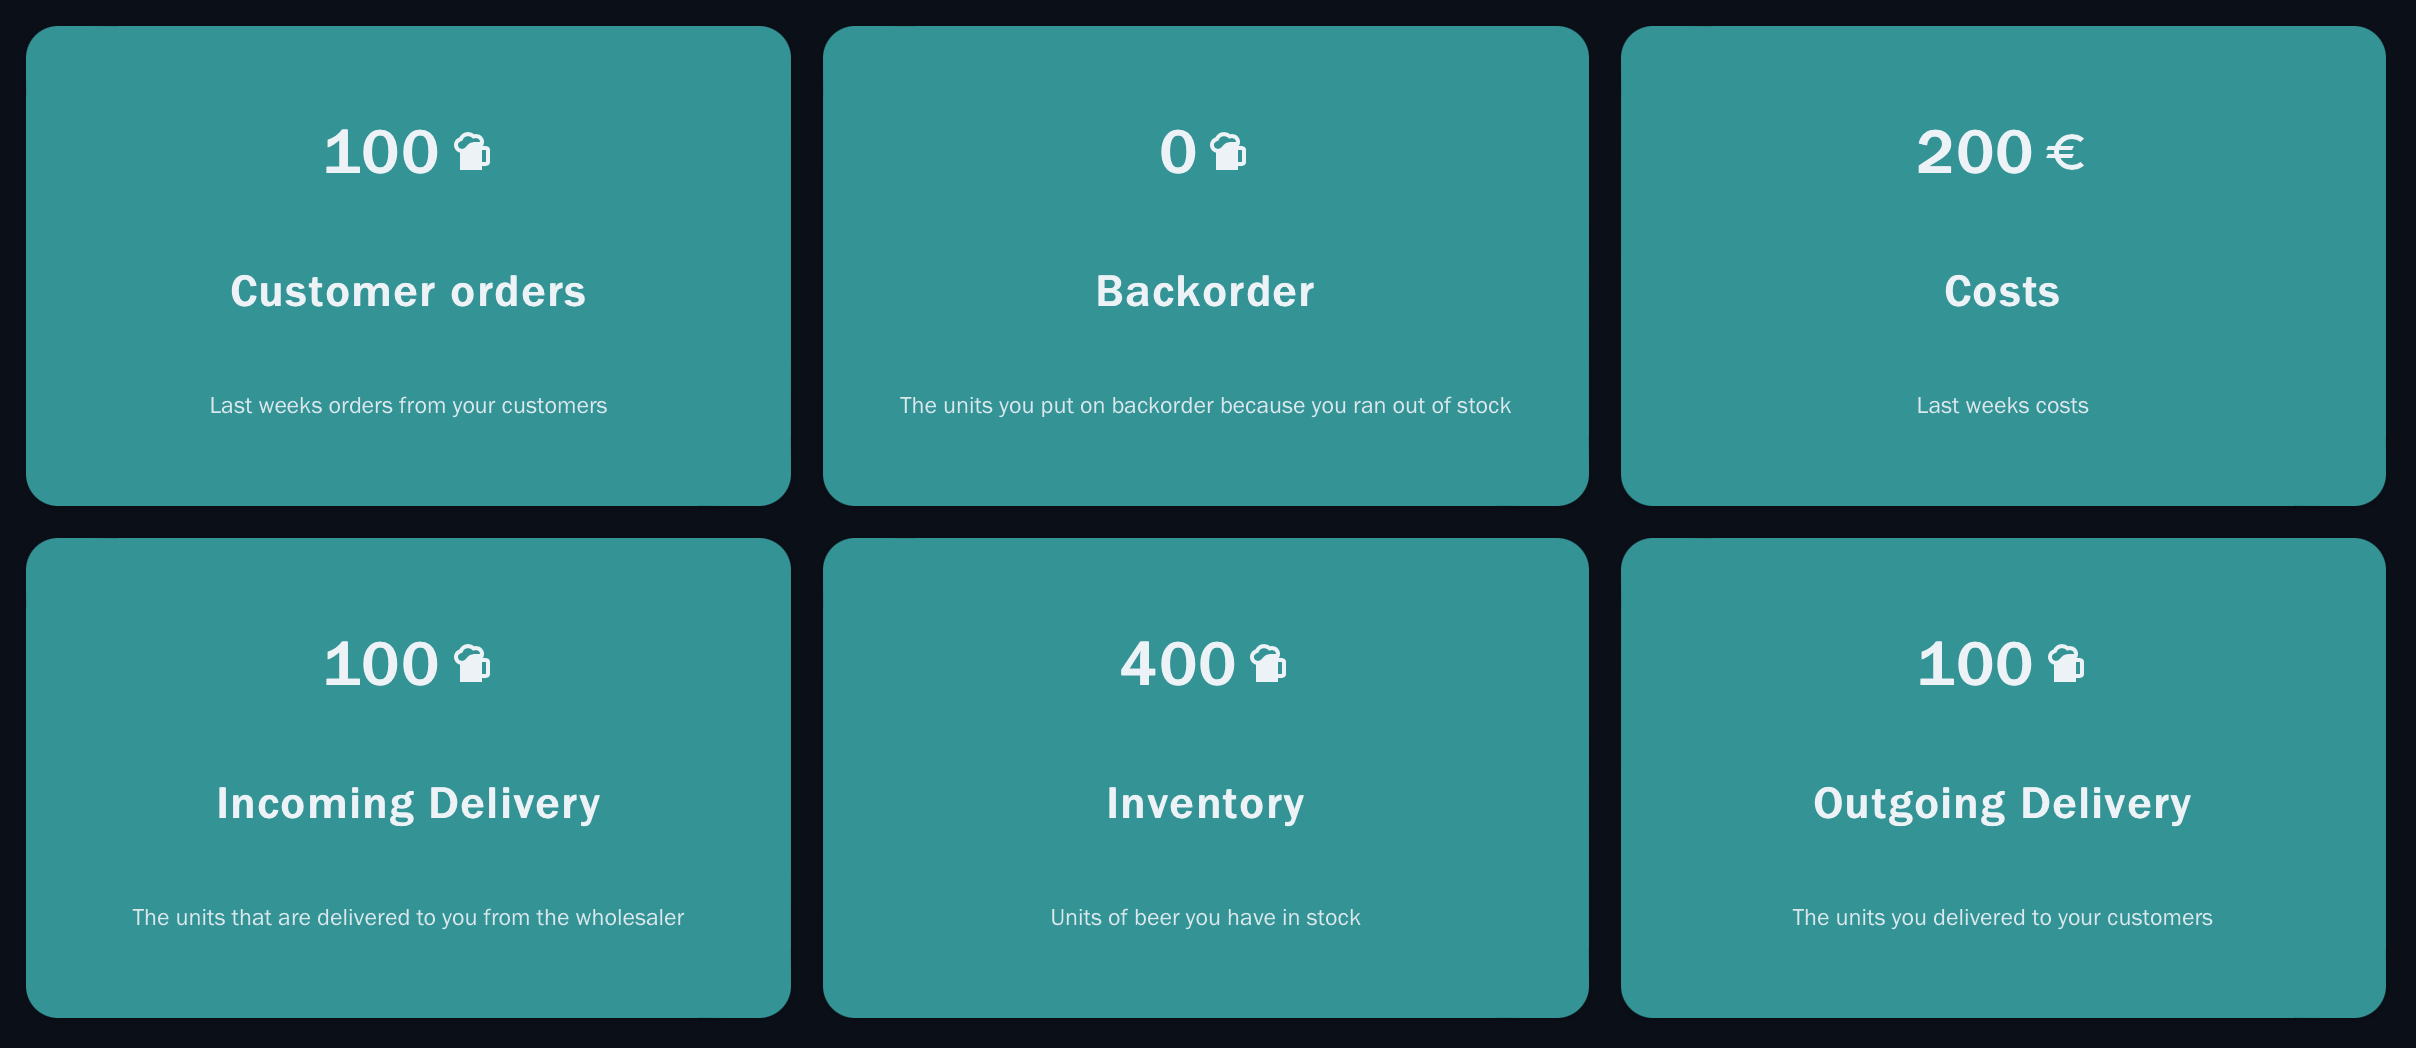
Beginning of Week 2
The dashboard below shows the summary of what happened during week 1 - it looks the same as the previous week's dashboard (because the supply chain is in a steady state).
At this point, we should take a look at the order history, which records all the KPIs for each
week.
The order history also contains two extra pieces of information: your order for the week and
the open orders.
It can be useful to see what your last order was - but the open orders are even more useful
because they show the amount of beer that should be delivered to you in the future.
For week one the open orders are at 100 units - given that we ordered 100 units at the beginning
of week one, this indicates that it takes one week for orders to arrive when the supply
chain is in a steady state.

The dashboard shows that nothing has changed - the supply chain is still in a stable state. So, we decide to order 100 units at the beginning of week 2.
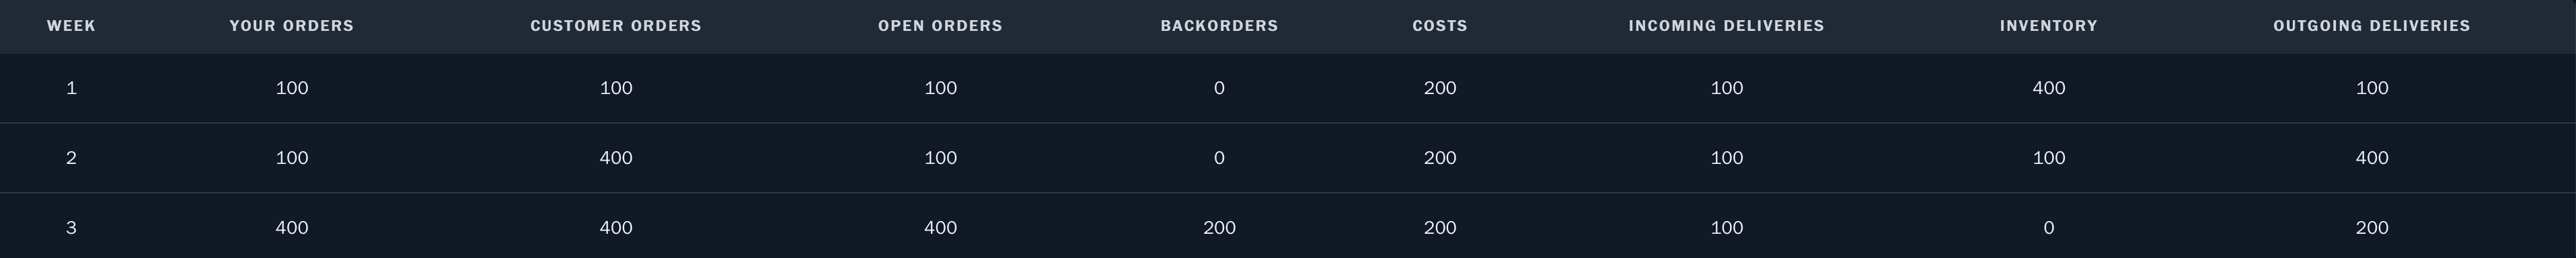
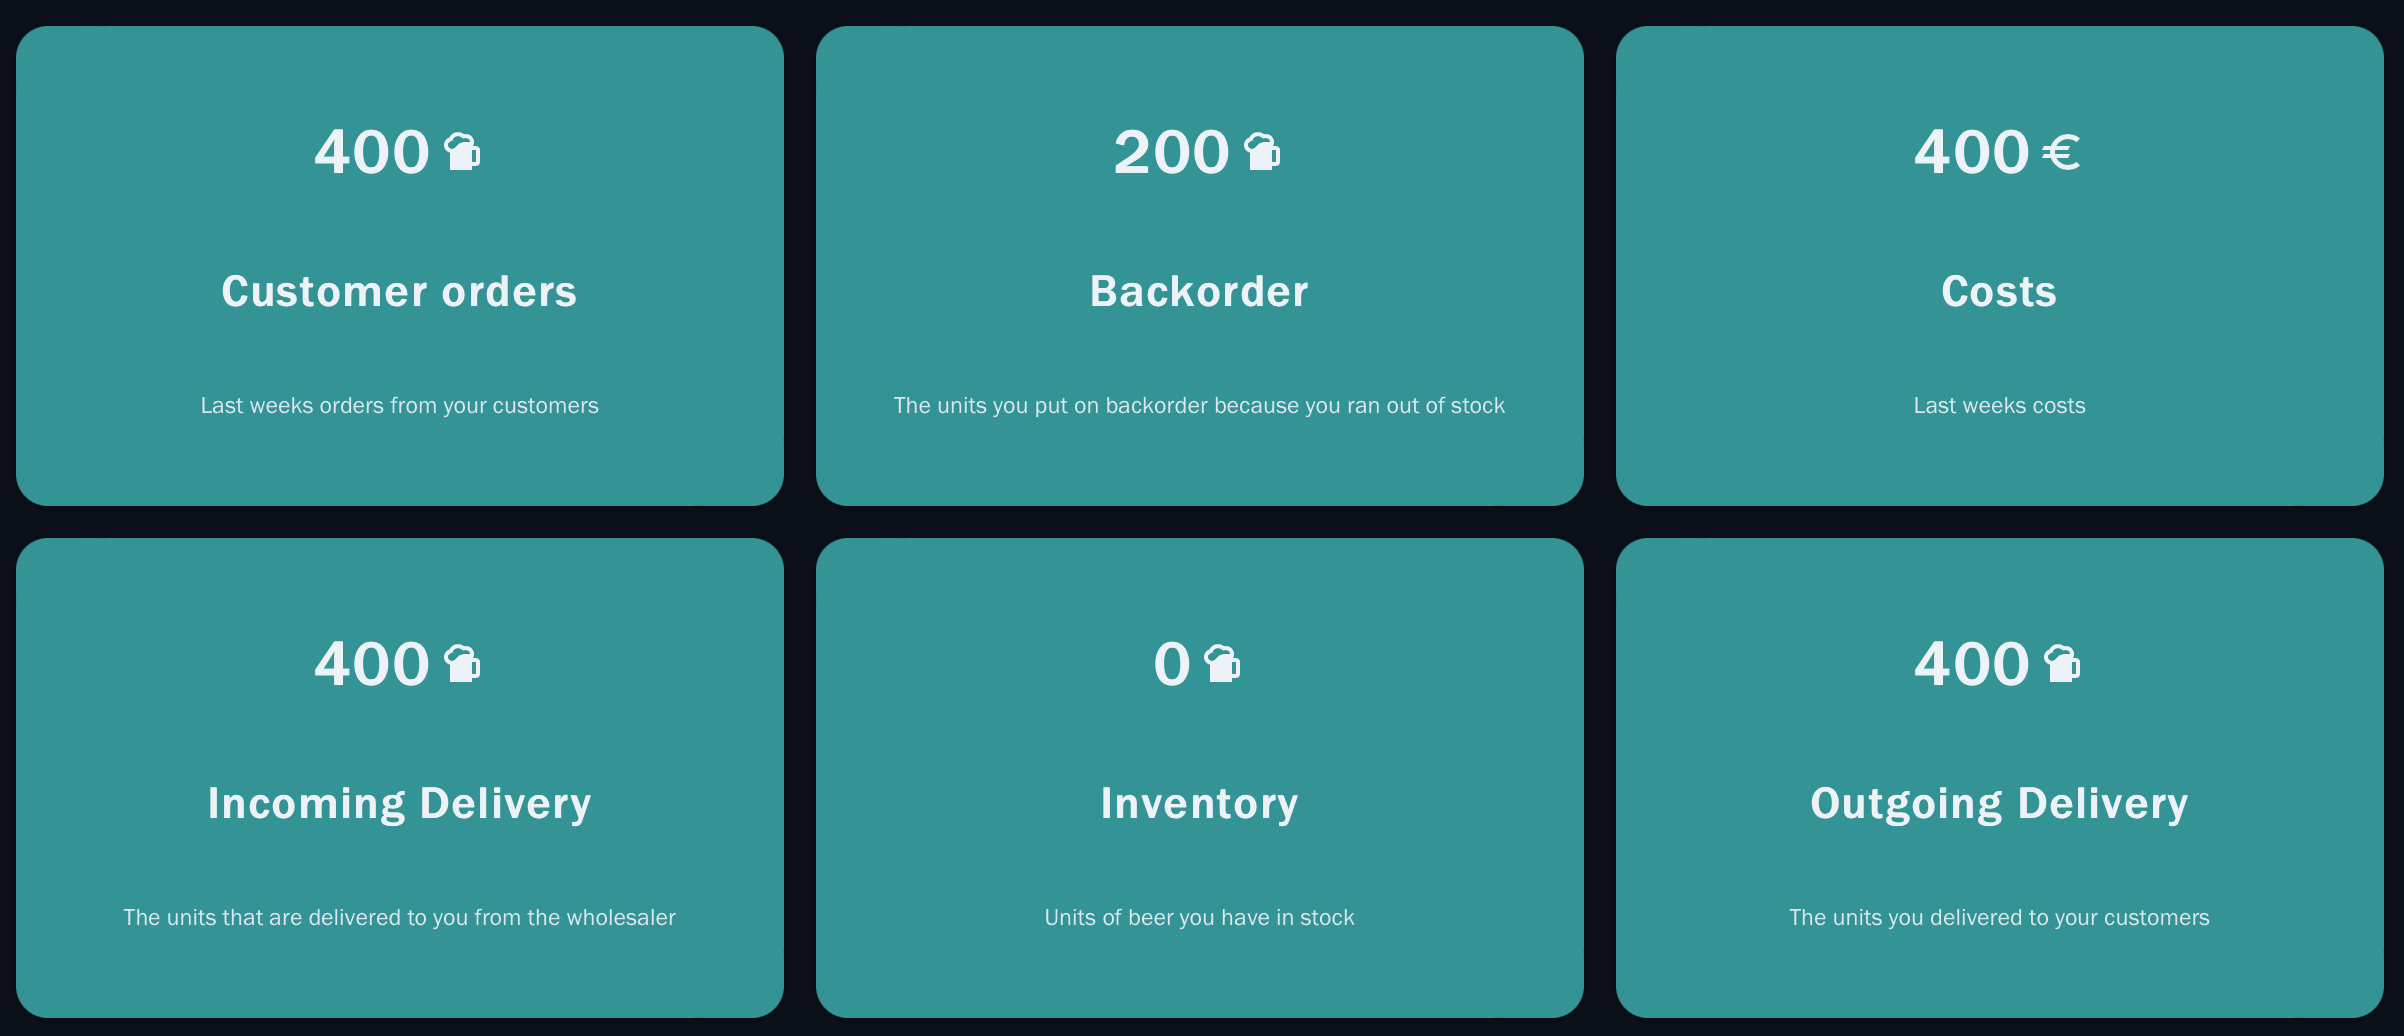
Beginning of Week 3
Now, for the first time, something changes: our customers order behavior changes and the customers suddenly order a total of 400 units of beer:
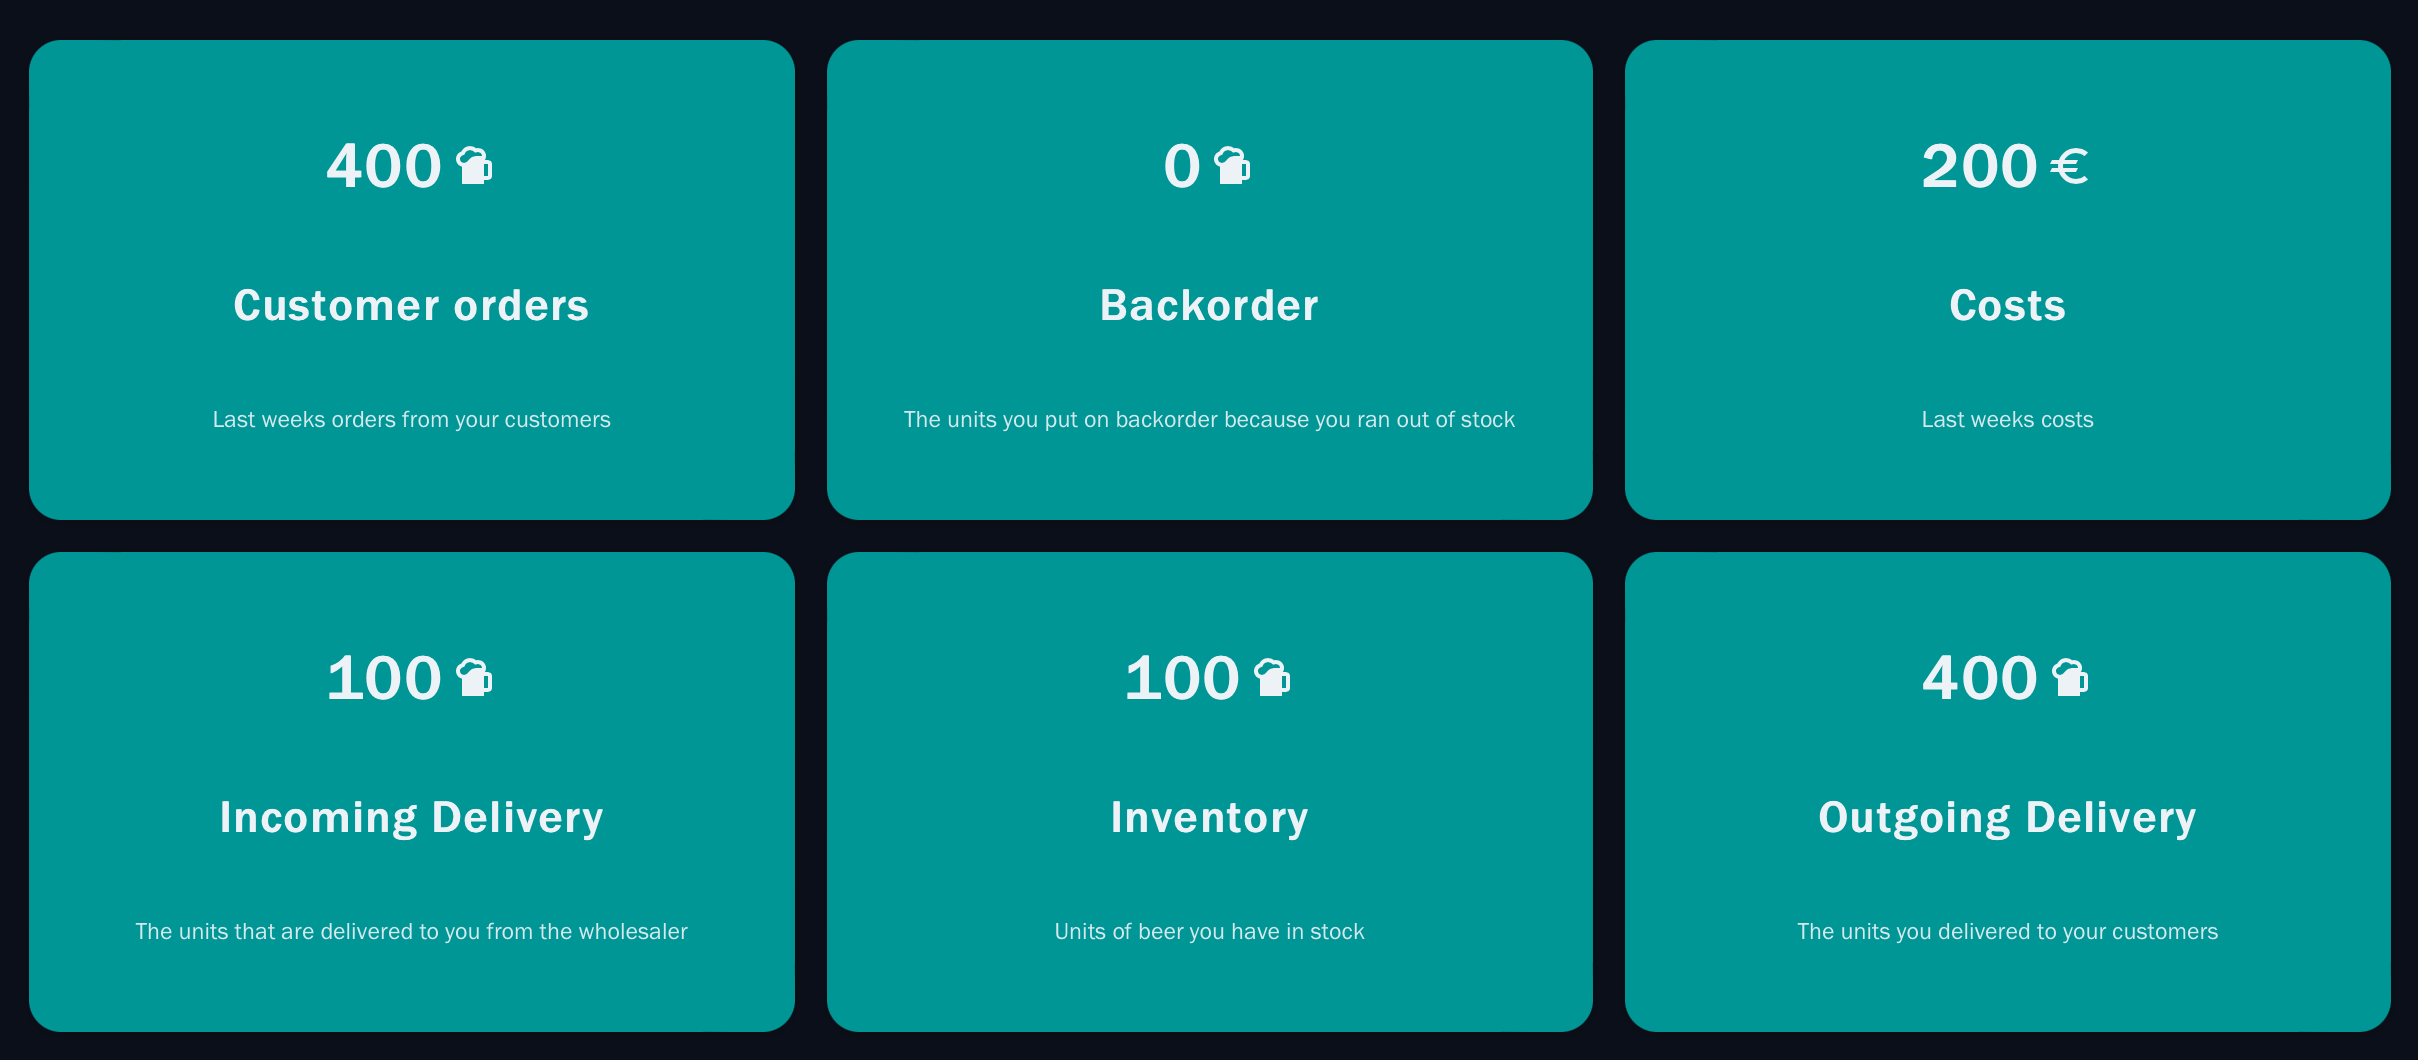
Let us take a closer look at what happened in week 2: our customers ordered 400 units. Fortunately, we had 400 units in our inventory, so we delivered the 400 units. This is why our back-order is still at 0.
We also received 100 units of beer, so our inventory is 100 (400 at the beginning of the week, plus 100 incoming, minus 400 outgoing).
Because our inventory was 400 at the beginning of the week and the back-order was 0, our costs for the week were €200.
All of this is also confirmed in the order history:

Our customers order 400 units of beer, so let us order 400 units, too.
NOTE: I do not want to spoil your fun of learning the right order behavior, so this is not the “best” order decision you could make at this stage – to learn about “ideal” order strategies, please take a look at our post “Understanding The Beer Distribution Game”.
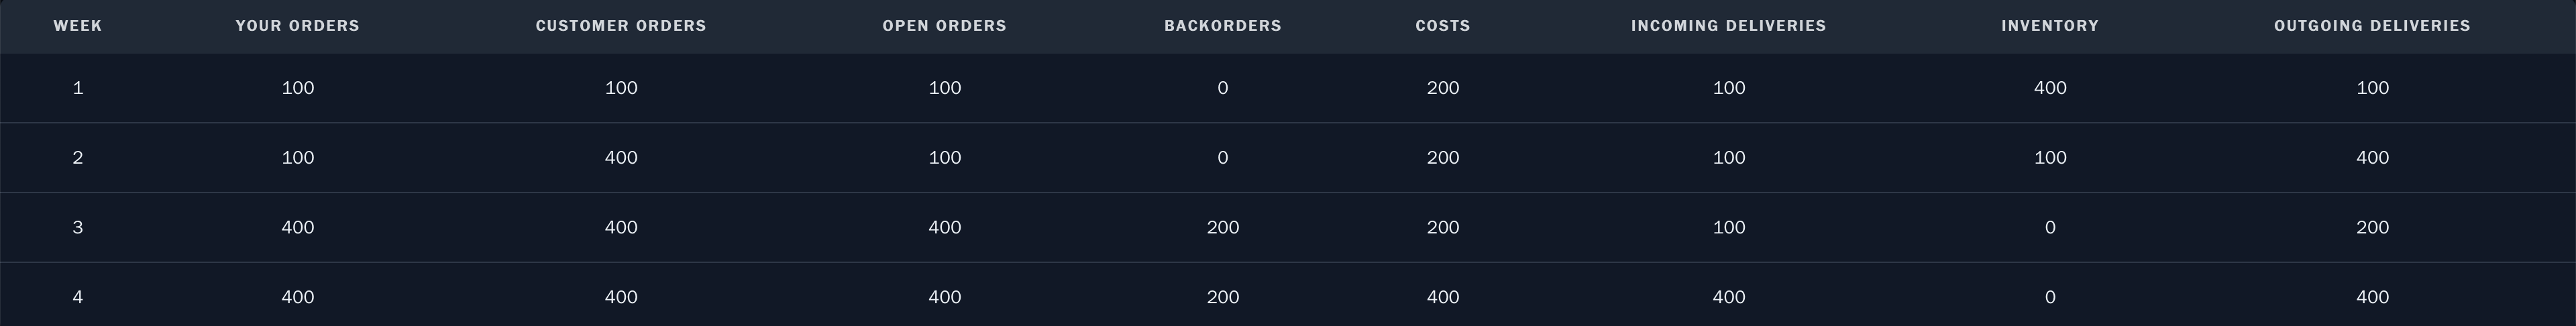
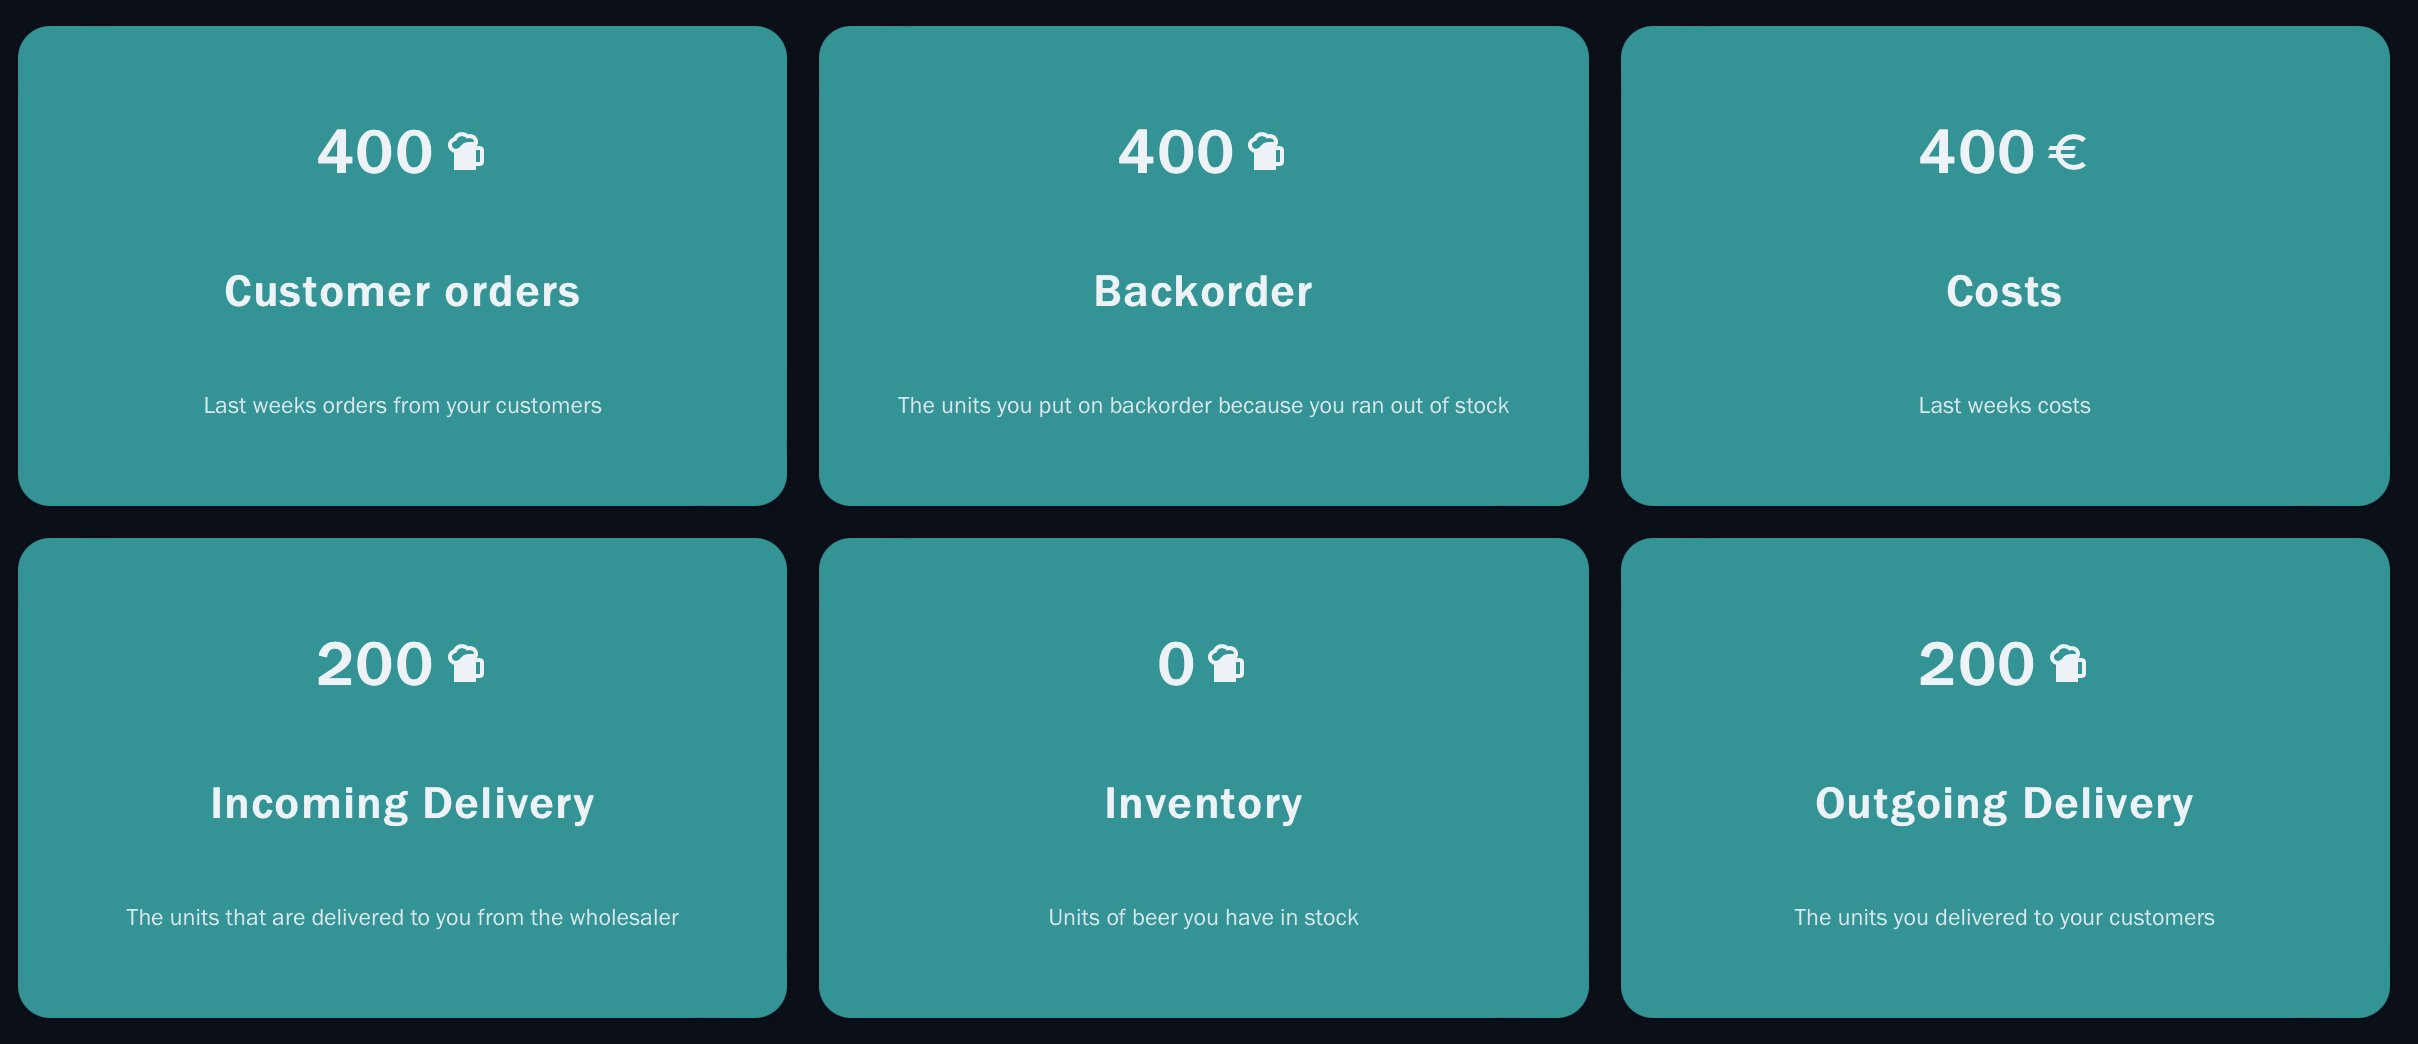
Beginning of Week 4
This results in the following dashboard at the end of week 3, beginning of week 4:
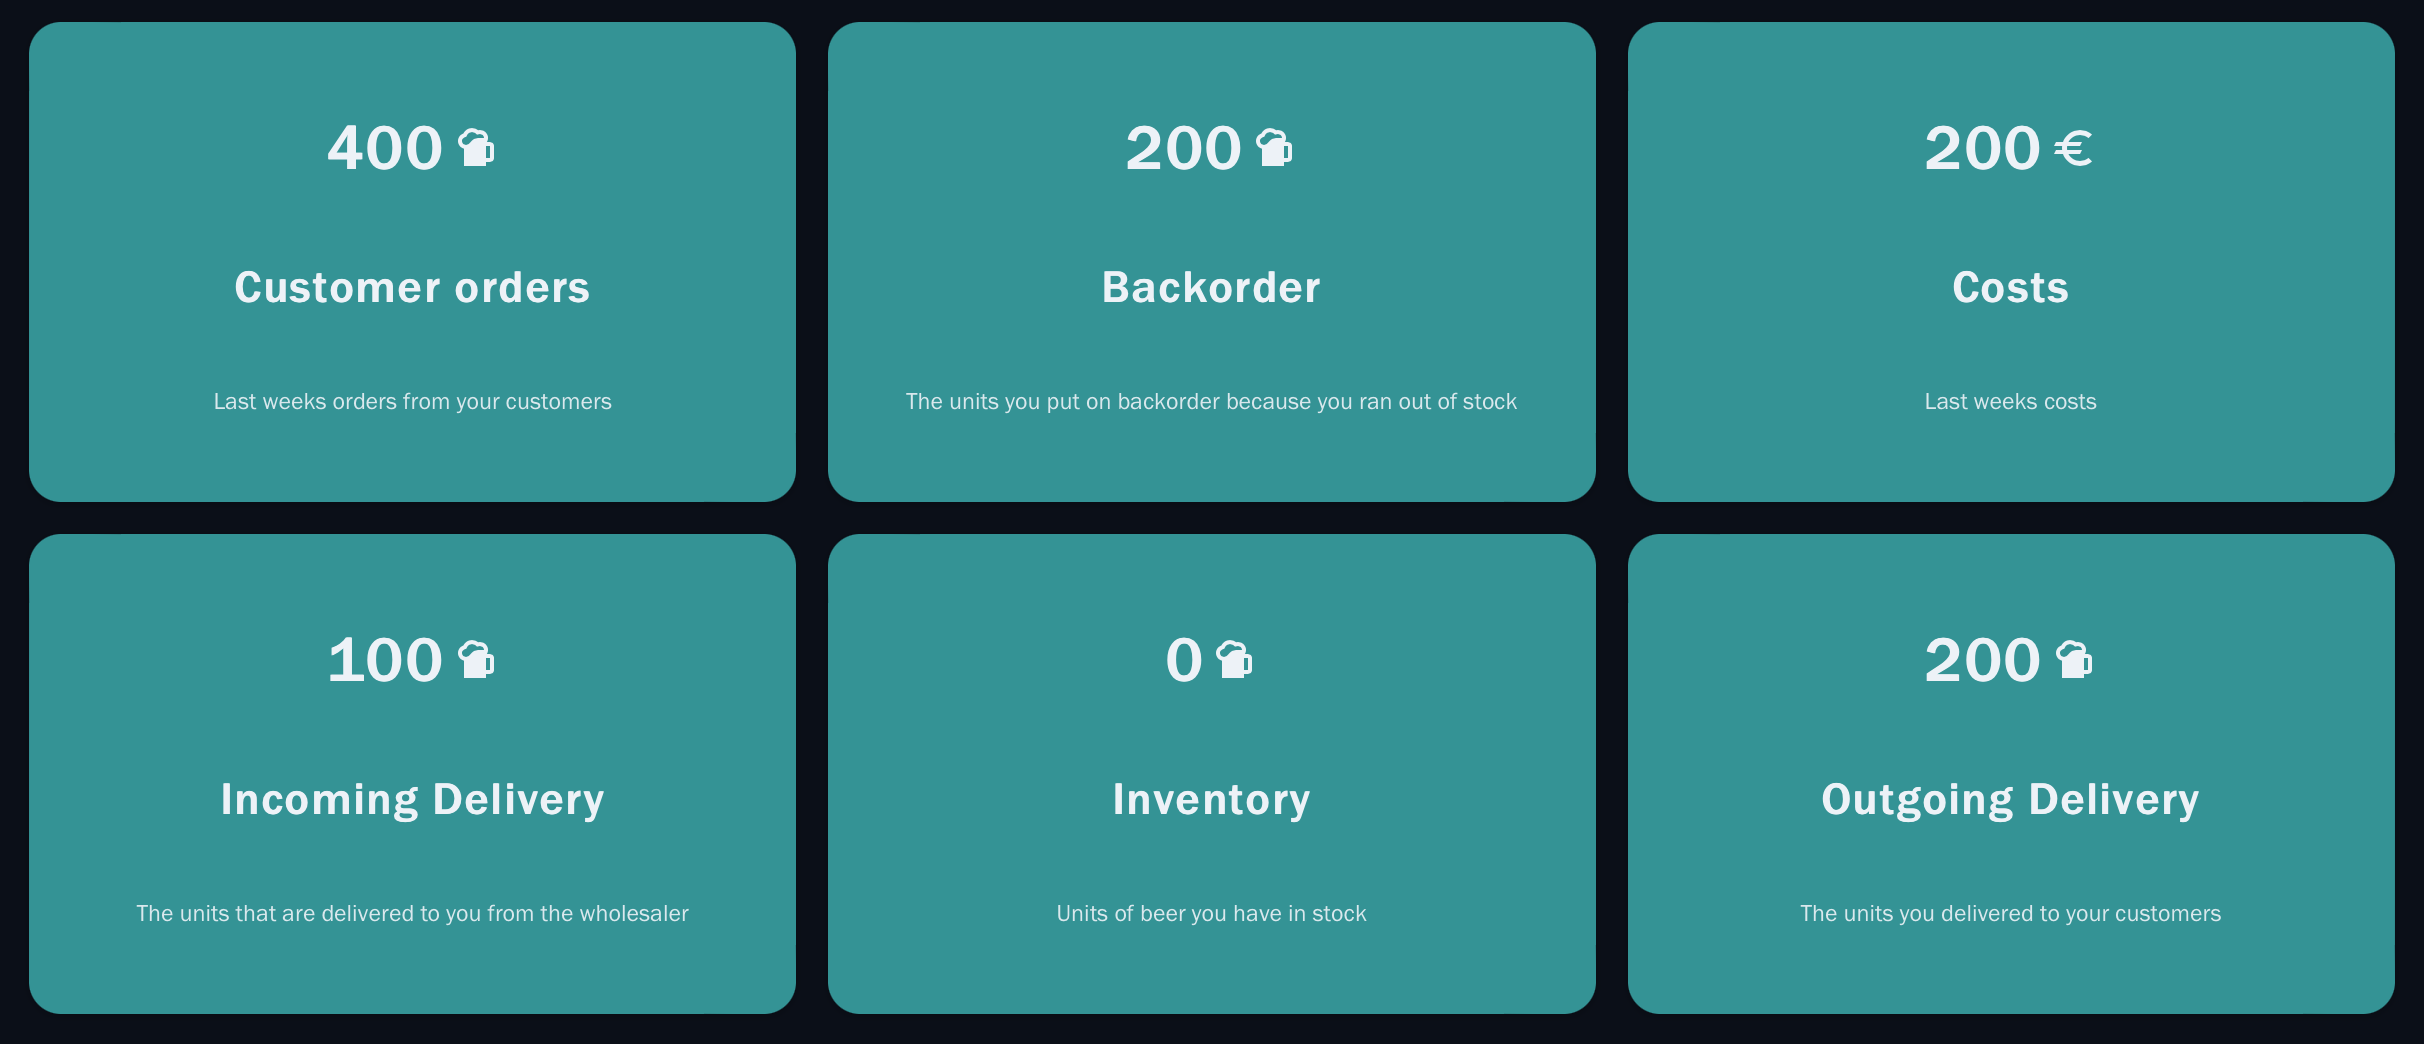
Again, our customers ordered 400 units of beer. We received 100 units (so our of 400 from
last week has not arrived yet).
Because we only had 100 units of beer in the inventory at the beginning of the week, we,
therefore, could only deliver 200 of those 400 units. Hence, our back-order is now at 200
and our inventory is at 0. Our costs for last week are still at EUR 200 because our back-order
was 0 at the beginning of the week, and we pay the minimum inventory cost of €200.
Let us check the order history - the 400 units we ordered last week now appear in the order history:
we had 100 open orders in week 2, plus 400 new orders in week 3, minus the 100 units
that were delivered to us leaves us with 400 units of beer as open orders.
Our customers ordered 400 units of beer, let us match that and also order 400 units.
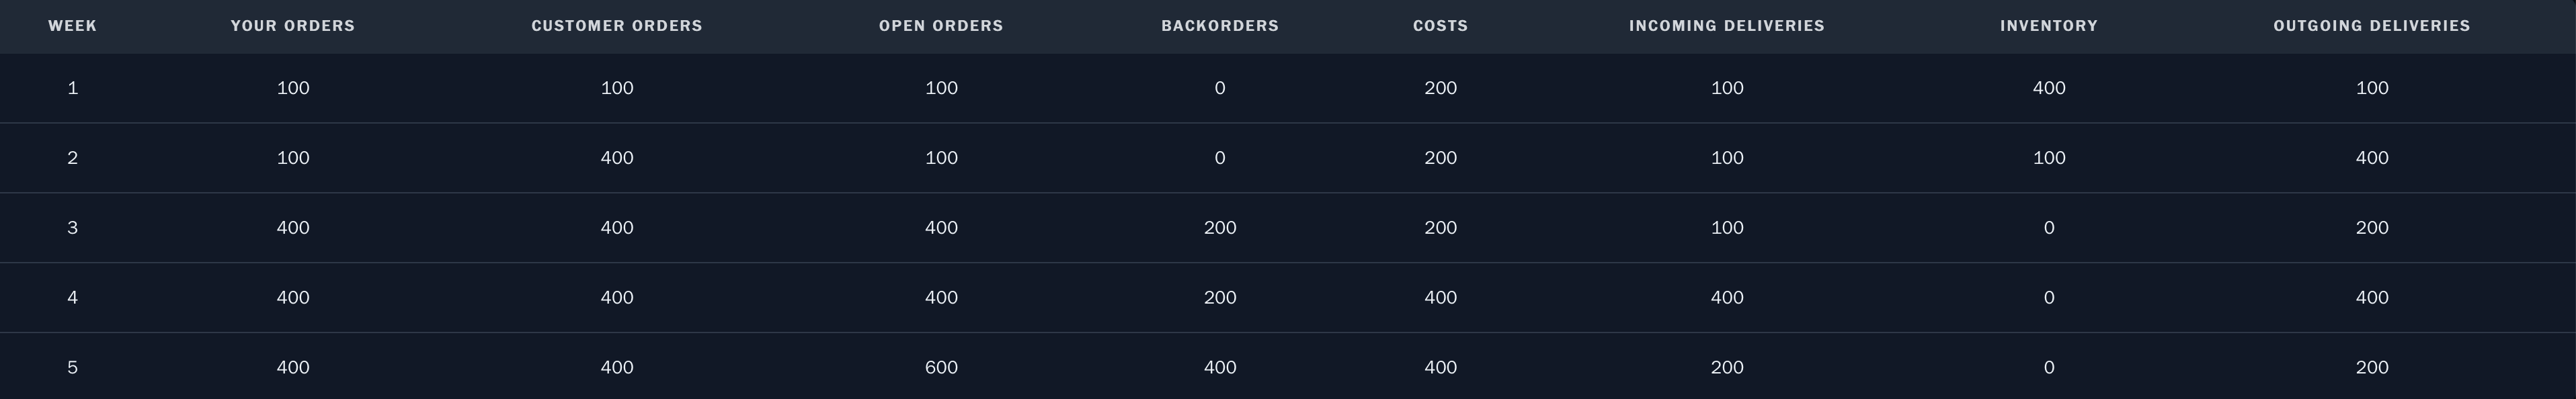
Beginning of Week 5
At the end of week four, our dashboard is beginning to look quite interesting: again our customers order 400 units.
But this week at last some of our previous orders are fulfilled, and we receive 400 units of beer. Because we had a back-order of 200 and our customers orders 400 units, we deliver all 400 units, leaving our inventory at 0 units and our back-order at 200 units.
Our costs are at €400 - the €200 minimum inventory costs plus €200 for our back-order (which was at 200 at the beginning of week 4).
Again, we order 400 units of beer to match our customers orders.
Beginning of Week 6
This leads to the following dashboard at the beginning of week 6:
Again, our customers order 400 units. We receive a delivery of 200 units and our inventory
was 0, so we deliver 200 units and our inventory remains at 0. This also means that our
back-order rises to 400 units.
Our costs are at €400, which is consistent with our minimum inventory cost of €200 plus €200 for the back-order of 100 at the beginning of the week.
Again, let us order 400 units.
Beginning of Week 7
At the beginning of week seven, we receive another 485 units, which we pass on directly to our customers, who again ordered 400 units. This means we reduce our back-order by 85 units, leaving it at 315 units on back-order.
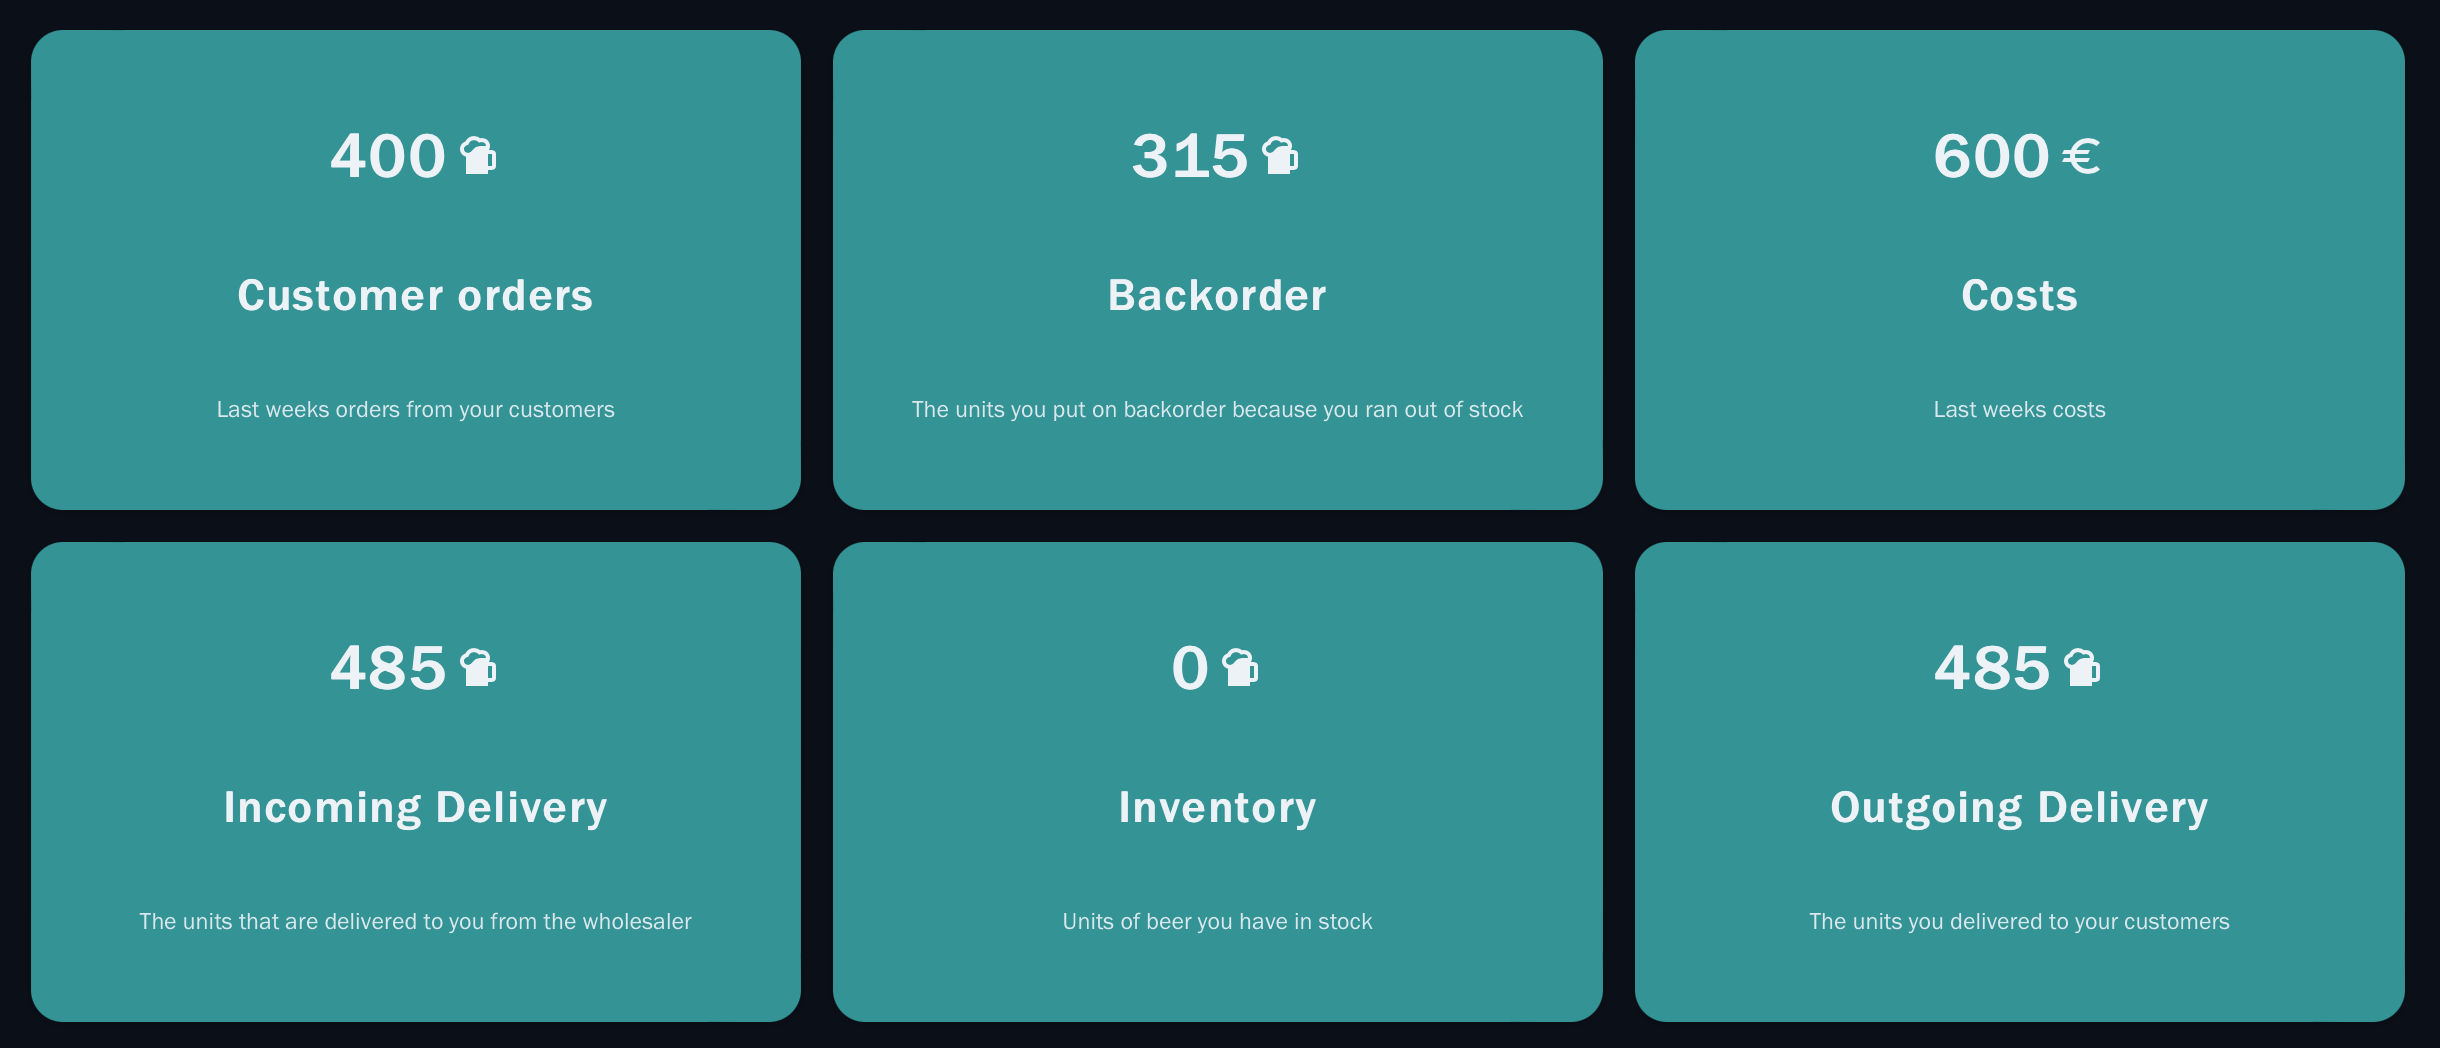
Our costs are at €600: the €200 inventory cost and €400 for last week's back-order.
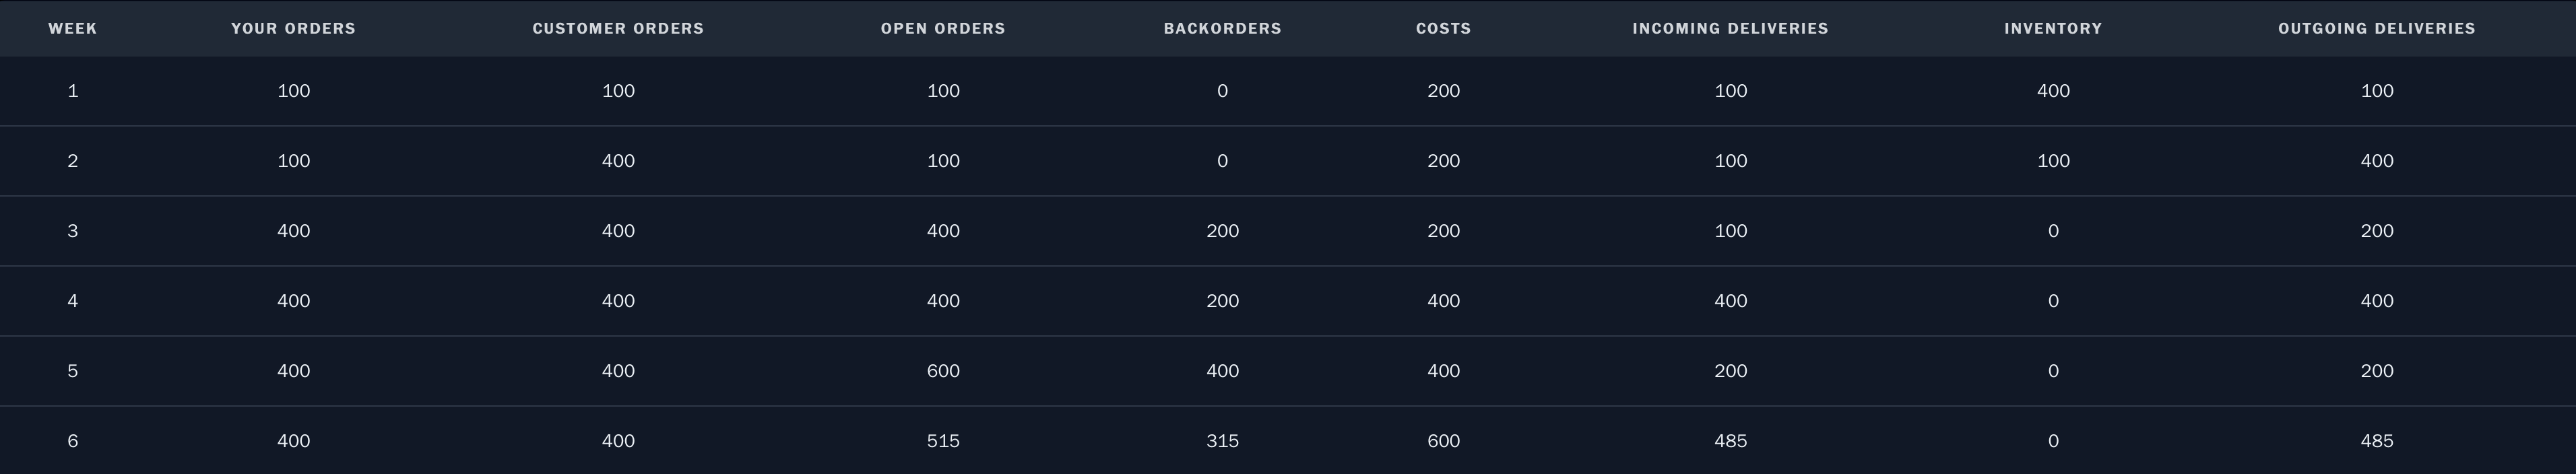
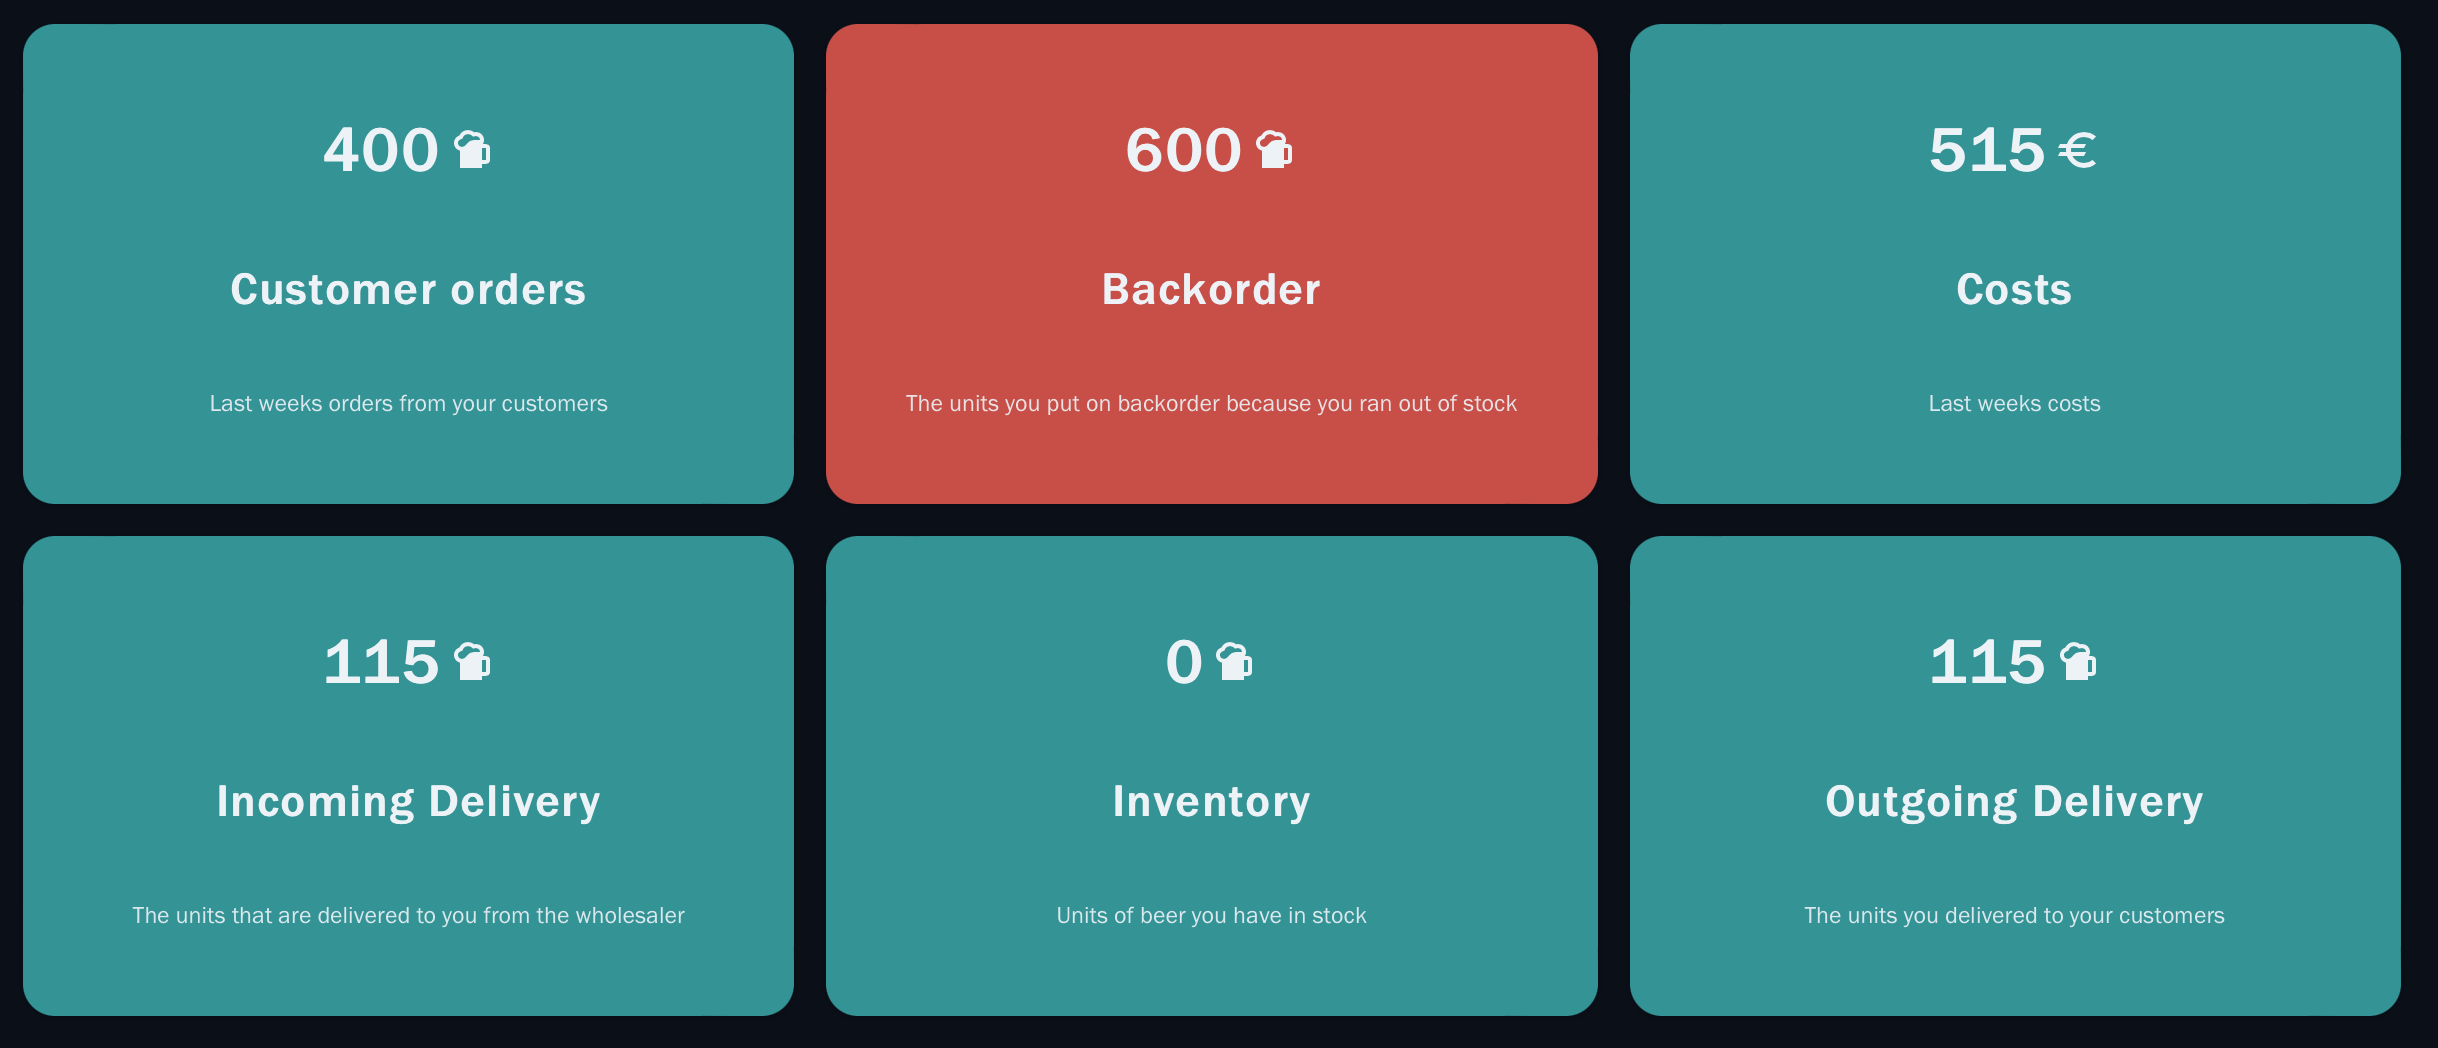
Beginning of Week 8
In week seven, our customers again ordered 400 units. But we only received 125 units, so our back-order rises to 600.
That is not good at all - which is why a red indicator light has gone on to show that we really do need to worry about our back-order.
The Performance Appraisal at The End of The Game
I am confident that you understand how to interpret the dashboard and the order history now. So let us fast-forward to the end of the game by ordering 400 units every round.
At the end of the game – after round 24 – we reach the performance appraisal.
The graphs on the performance appraisal show you how your orders, inventory, back-order, surplus and costs developed over time.
If you would like, you can also check the graphs for the other players in the supply chain.
You can even download all the data and view it in a spreadsheet or import it to an analytics tool.
Here is a comparison of each player's order behavior: we can see that the customer just changed his order once, and we as the retailer followed suit.
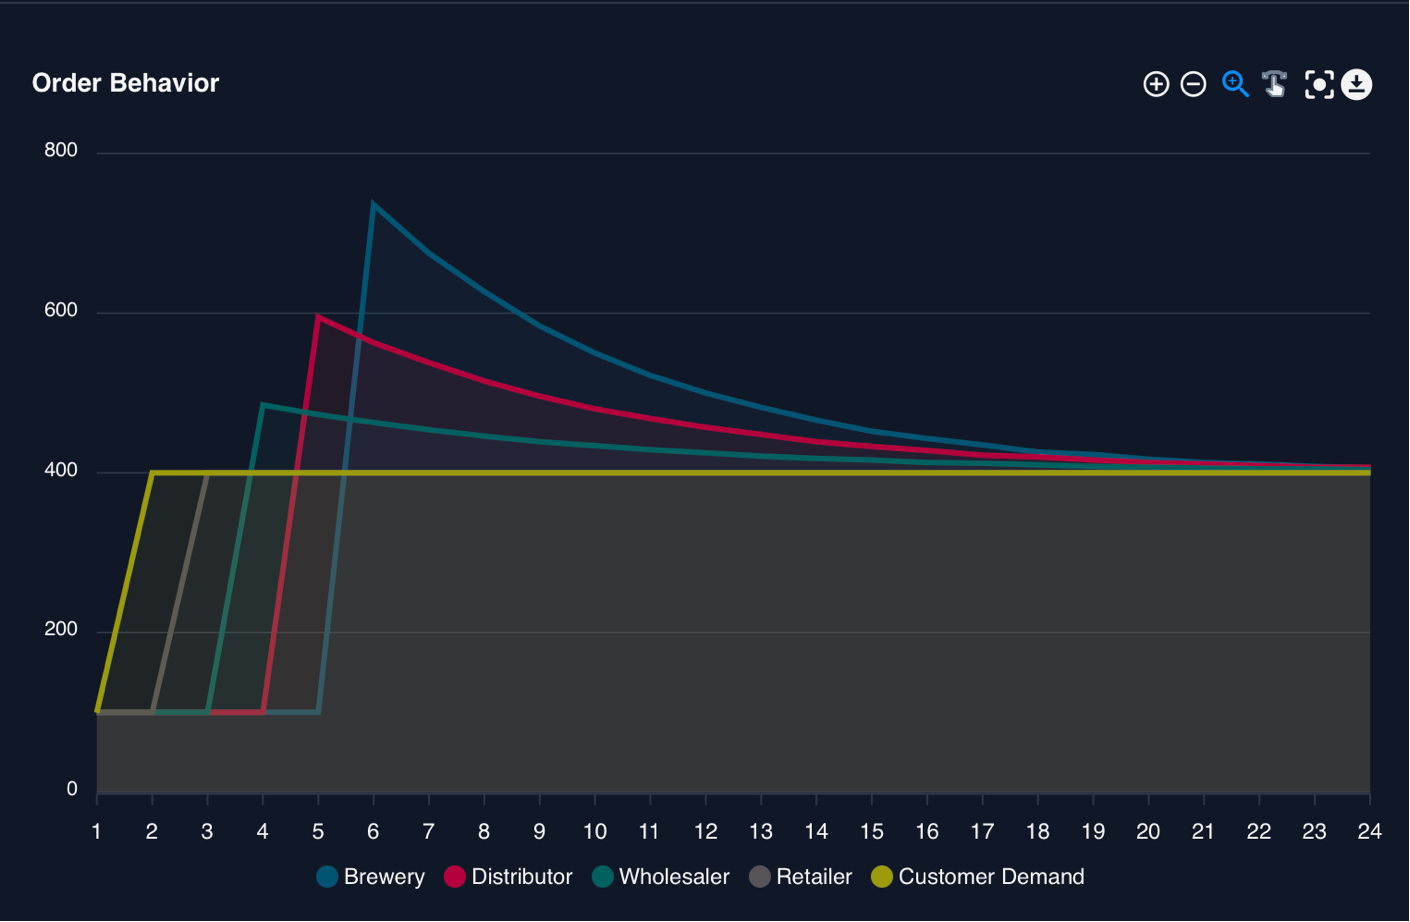
We can also see that each player along the supply chain orders an amount slightly larger than the player before him, leading to the well-known "bullwhip" or "whiplash" effect.
Why didn't we – as the retailer – order a slightly larger amount? A quick check of our inventory at the end of the game will show that we probably should have done ...
Of course, what interests us most are our cumulative costs because they show whether we reached our performance targets.
We can see that our costs are far too high, and that the other players costs are much lower ... so obviously our ordering behavior wasn't good.
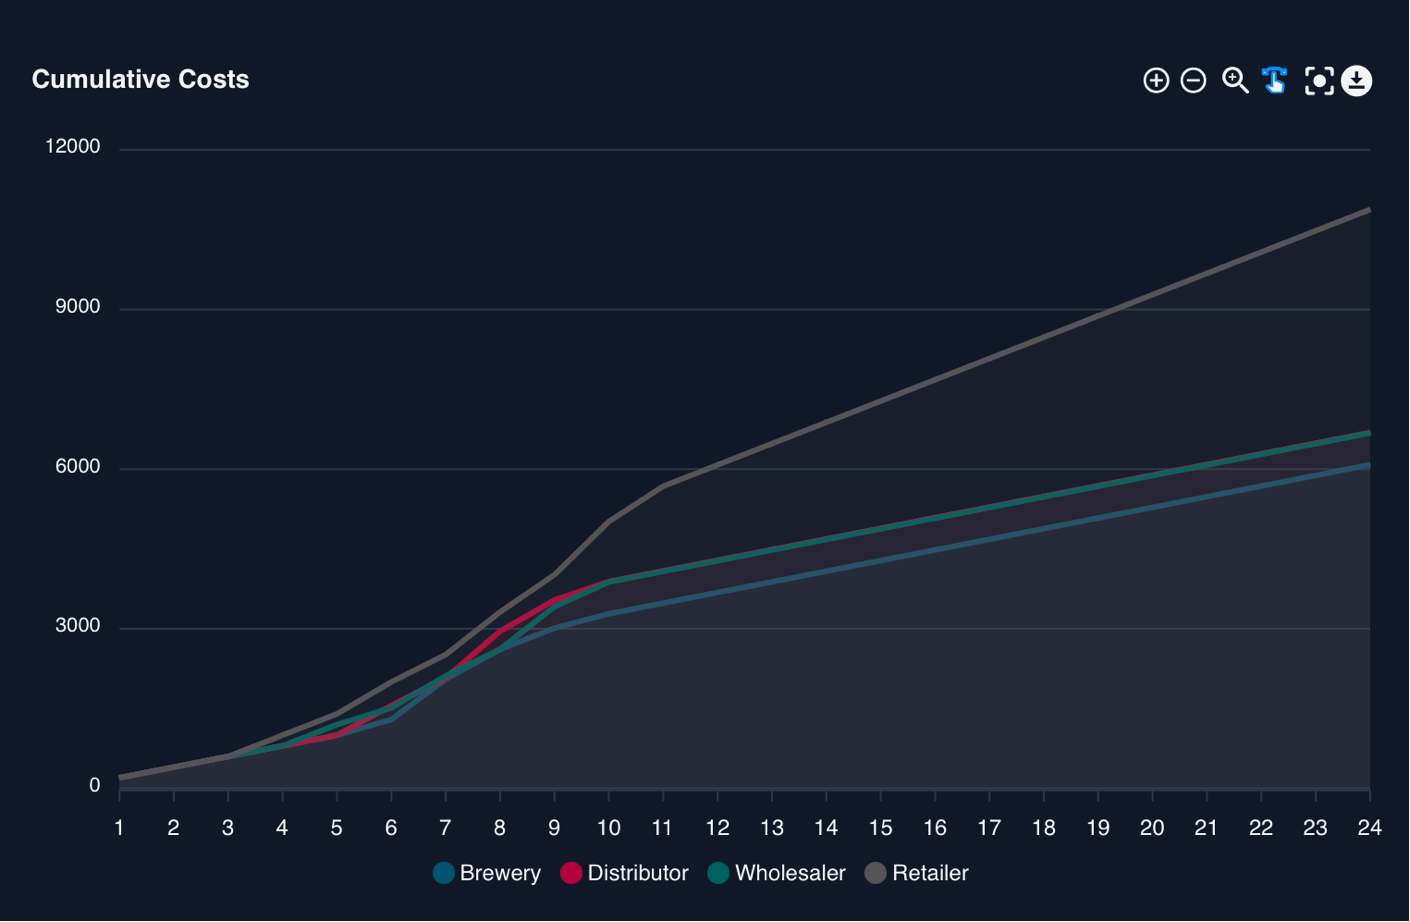
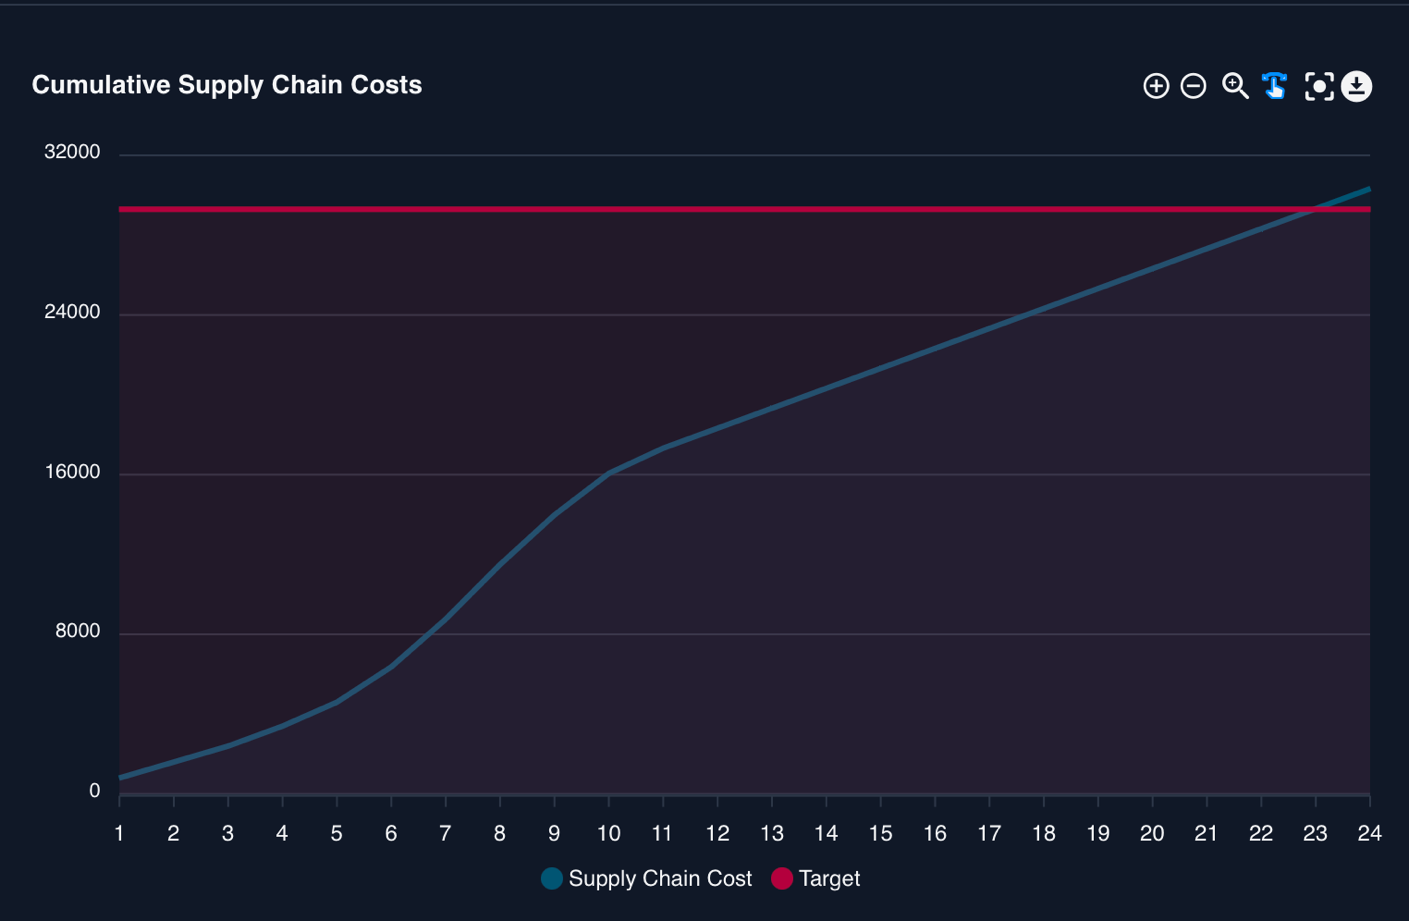
Because our costs were so high, the overall supply chain cost were also above the target.
A check of our back-order shows that our back-order was never below 200 units after week three ... so we were penalized every week.
Needless to say, we also did not reach our inventory target of 400 units in stock.
A nice measure that combines both the back-order and the inventory is the surplus, which is inventory minus back-order.
Because we want the back-order to be 0 and the inventory at 400, the surplus target is also at 400.
The graph below shows that we failed quite miserably at this - our final surplus is at - 200 because our inventory is 0 and our back-order is at 200.
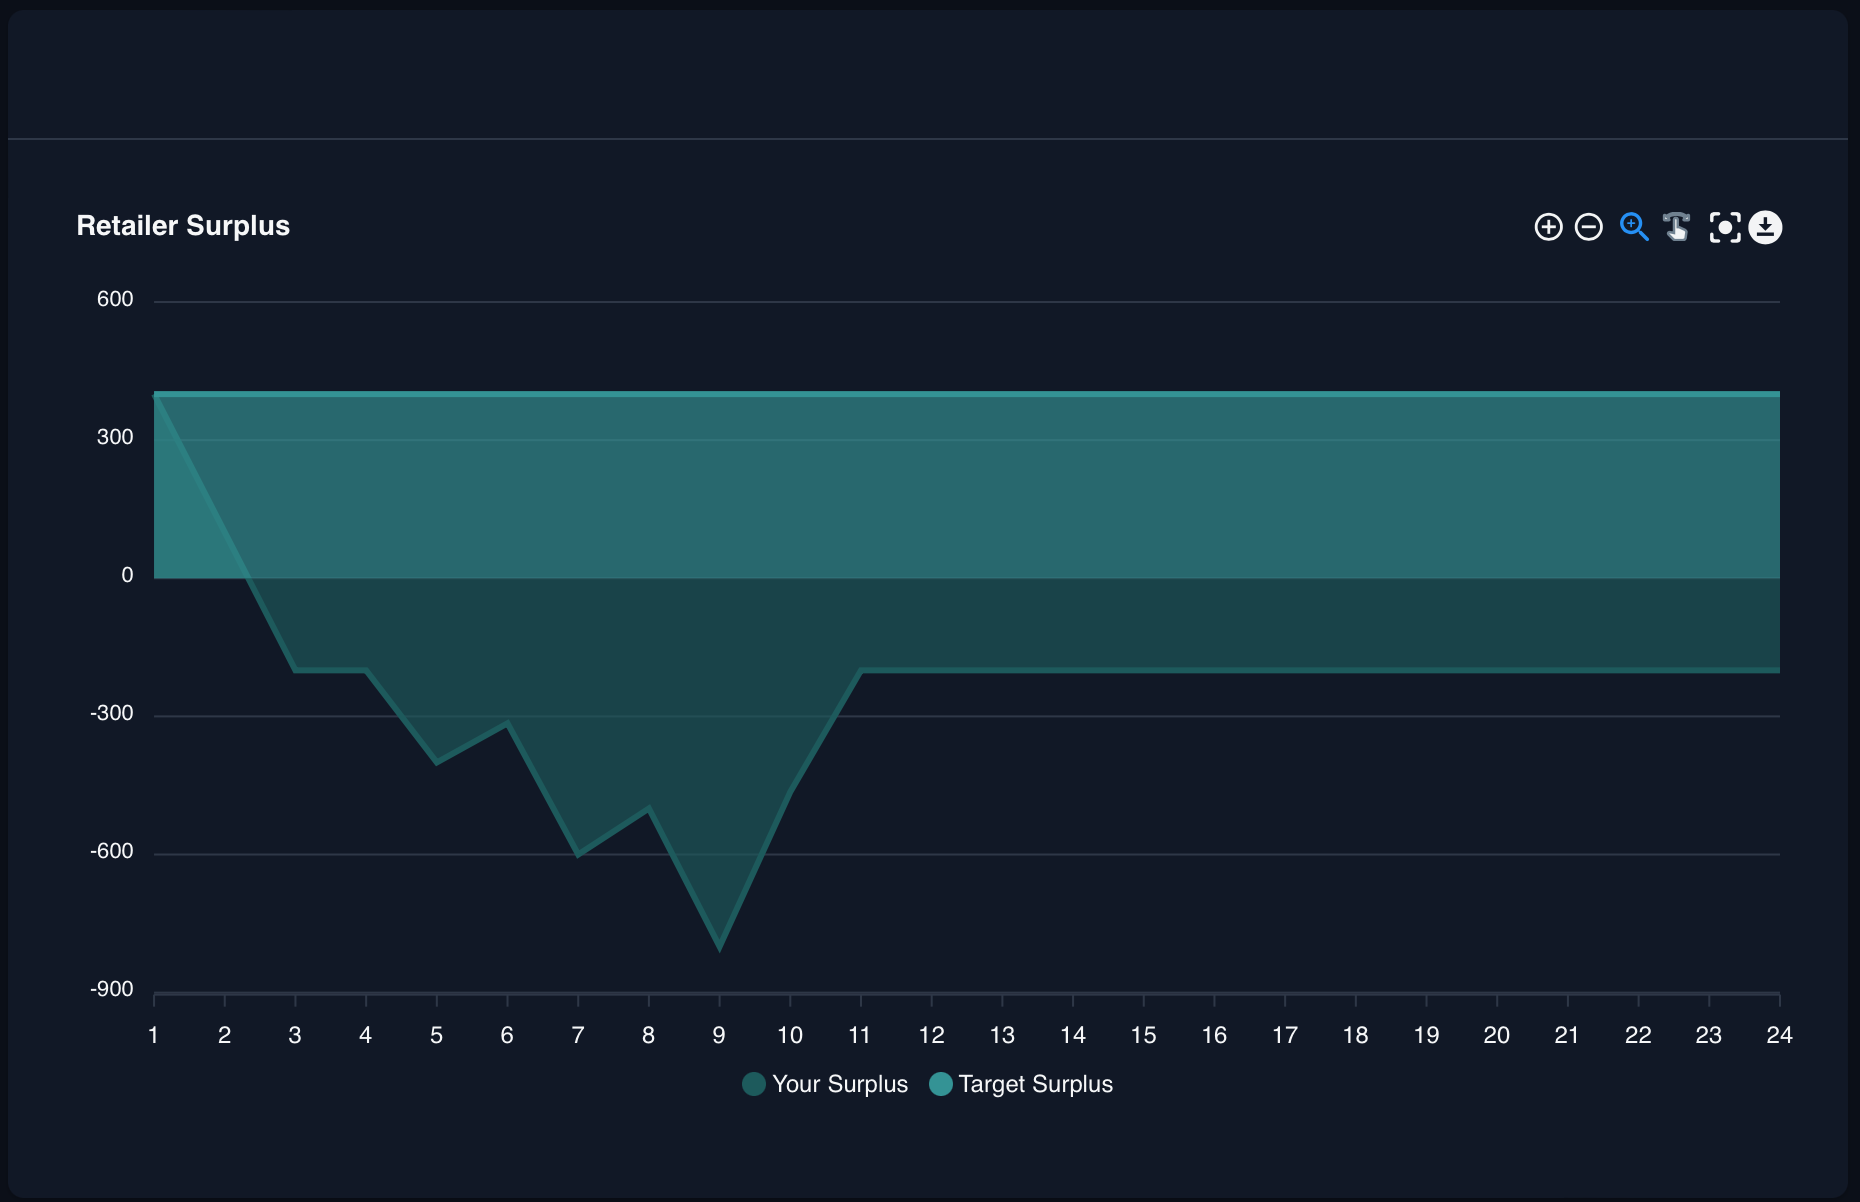
I am sure you can do much better than this next time around.
Summary
This brings us to the end of our walk through the Beer Distribution Game. You should now
fully understand:
- the game objectives and how they are measured
- the dashboard that is presented during the game
- the order history
- how costs are calculated based on the information in the order history
- the charts in the performance appraisal
Thank you for joining me on this walk, I hope you enjoyed it as much as I did.
Table of Contents


Services
Resources
All Rights Reserved.