
Re-Think Your Operating Model with AI
Many operating models live in slide decks, spreadsheets and the heads of senior people. Here is how we turn one into a computational knowledge graph you can question — built live, with AI as a co-modeller.
Oliver Grasl
22.6.2026
Many enterprises cannot answer simple questions about how they actually run — which step is the real drag on our delivery times? which initiative fixes which problem? — because the answers are spread across disconnected slide decks, spreadsheets and experienced people's heads. In a recent live session we showed an alternative: starting from a blank page and a handful of ordinary documents, we built a computational knowledge graph of a company's operating model — strategy, operations and measurement in one connected, typed model — with AI doing the heavy lifting and a human steering. The result is a model you can ask questions of and get answers you can trace, challenge and re-run. This is the core of what we call operating model engineering, and it is fundamentally different from running an AI assistant over your documents.
The Challenge: Your Operating Model Is Everywhere and Nowhere
Every enterprise has an operating model — the way it actually turns strategy into delivered work. Few enterprises have it written down in any usable form.
Instead, it lives in fragments. The strategy sits in a board deck. The processes are in a Visio diagram nobody has opened in two years, or in the head of the operations lead. The KPIs are in a monthly spreadsheet. The org chart is in the HR system. The list of transformation initiatives is in a programme plan. Each artefact is internally consistent and mutually disconnected.
So when a senior leader asks a perfectly reasonable question —
"We want order-to-delivery down to 1.5 days. Which step in our process is the biggest drag on that, and which of our scoped initiatives actually fixes it?"
— there is no single place that can answer. Someone has to reconcile the deck, the spreadsheet and the process notes by hand, in their head, and present a slide. By the time the next question lands, the slide is already out of date.
The operating model is everywhere, and nowhere. It is the most important thing an enterprise owns, and it is the thing it can least readily inspect.
What We Mean by "Operating Model
When we say operating model, we mean three layers and the connections between them:
- Strategy — where the enterprise wants to go: its goals and the initiatives meant to get it there.
- The operating model proper — how it organises to deliver: the capabilities it relies on, the teams that hold them, the systems they run on.
- Operations — where the work actually happens: the processes and the individual activities that make up each one.
Threading through all three is measurement — the KPIs that tell you whether strategy is reaching the work.
Many enterprises have these three layers in three disconnected slide decks. The value is in connecting them.
The point of an operating model is not any one layer in isolation. It is the *traceability between them*: being able to follow a thread from a strategic goal, down through the KPI that measures it, into the process and the specific activity that drives it — and back up to the initiative meant to improve it. That thread is exactly what fragmented documents cannot give you.
The Two Approaches That Don't Quite Work
If you try to fix this today, you usually end up in one of two camps.
- Top-down governance. Hire enterprise architects, adopt a framework, mandate a modelling tool, and document the enterprise properly. This produces real rigour — but it is slow, expensive, and the model tends to drift out of date the moment the documentation effort stops. The map becomes a compliance artefact rather than a living decision tool.
- Bottom-up mining. Point process-mining or data tools at your event logs and let the structure emerge from the traces. This is fast and grounded in reality — but it only sees what is already instrumented in your systems, and it tells you what *is* happening, not what *should*, nor *why*, nor *who owns it*. The strategy layer is invisible to it.
Both are valuable. Neither, on its own, gives a senior leader a connected model of strategy-through-to-work that they can interrogate in the room, today, with the messy documents they already have.
That gap is what we set out to close.
Our Approach: Build the Model Live, With AI as Co-Modeller
The approach we demonstrated in our live session is simple to state: take the ordinary documents an enterprise already has, and build a typed knowledge graph of the operating model directly from them — collaboratively, with an AI assistant doing the parsing and proposing, and a human steering.
A few words on the terms, because they matter:
- A knowledge graph is just information represented as nodes (things — a goal, a process, an activity, a KPI) and edges (typed relationships between them — this activity drives that KPI; this initiative addresses that step). Unlike a document, you can follow the relationships.
- We call it a computational knowledge graph because it is not just a diagram to look at: the nodes carry real attributes — touch time, error rate, volume, execution type — that an AI or a human can compute over to answer questions, simulate alternative scenarios and rank options.
- The AI works as a co-modeller, not an oracle. It reads a document, proposes how to represent it, and the human corrects and steers. It proposes; you decide.
Crucially, we don't impose a fixed template. We don't tell the AI what an operating model "should" look like. We let the structure — the node types, the relationships — emerge from the company's own language in its own documents. That is what keeps the model honest to the enterprise rather than to a framework.
The tool we used to do this is Metapad, our platform for building enterprise digital twins, which gives the AI assistant direct, structured access to the model as it is built. But the approach is the point, not the tool.
The Worked Example: GreenLeaf Wholesale
To make this concrete — and to prove nothing was pre-baked — we built a model live, from an empty page, for a fictitious company in front of the audience.
GreenLeaf Wholesale GmbH is a mid-size distributor of organic food and eco-household products: ~600 retail accounts across the DACH region, two warehouses, ~4,500 SKUs, €58m revenue growing ~25% a year. Its burning platform is a familiar one: growth has outrun the back office. Around 70% of orders still arrive by email and phone and are keyed into a legacy ERP by hand; stock is allocated on spreadsheets and phone calls; retailers are churning over late, incomplete deliveries. Leadership wants to double the customer base — and the operating model can't take the load.
All we started with were four ordinary documents — the kind any enterprise has lying around:
- a leadership memo from the MD ("why we have to change how we run");
- a process write-up of how an order actually flows today, warts and all;
- a one-page KPI snapshot (current vs. target);
- a short strategy note listing three scoped initiatives.
We handed them to the AI one at a time and built the model layer by layer. The memo became the strategy layer — 5 goals, 3 initiatives. The process write-up became the operations layer — an 8-step order-fulfilment process, each activity carrying its execution type (manual / semi-automated / automated), handling time, volume and error rate. The KPI sheet became the measurement layer, wired back to the goals it measures and the activities that drive it.
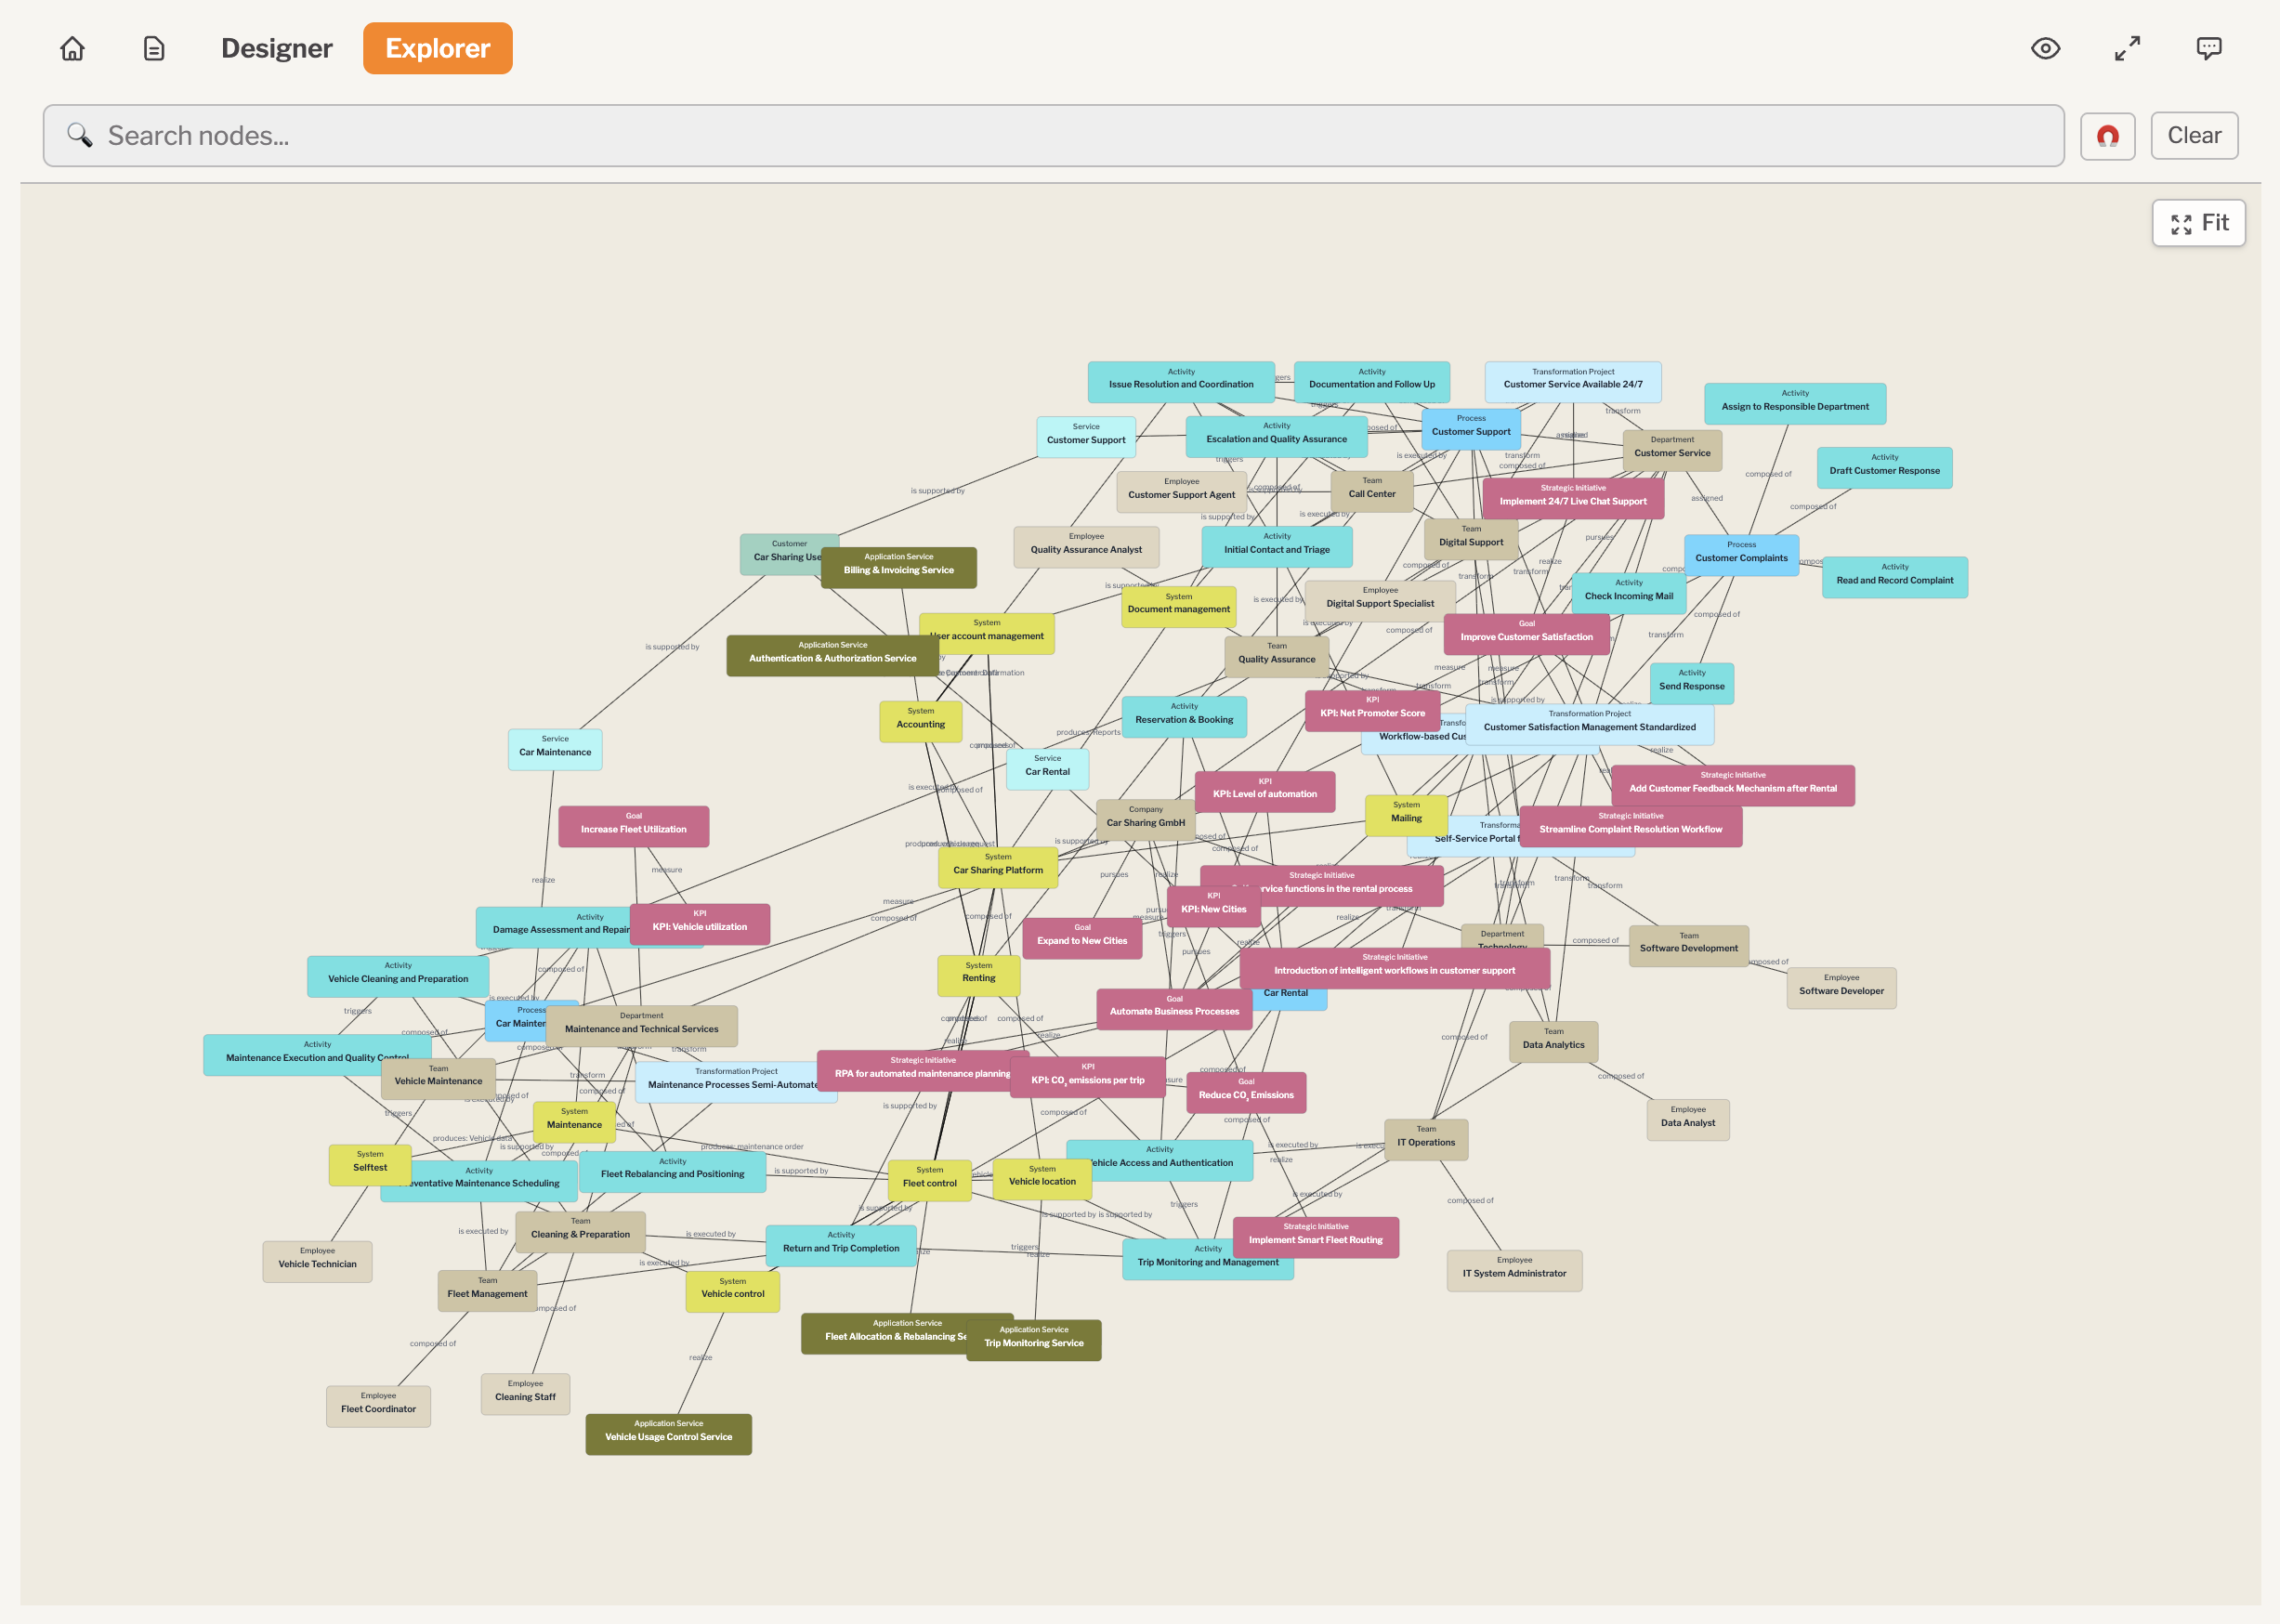
A mere twenty minutes later, we had this:

From a blank page to a connected model in ~30 minutes: 34 nodes across strategy (Goals, Initiatives), the operating model (Teams, Systems), operations (the order-fulfilment Process and its Activities) and measurement (KPIs), held together by 69 typed relationships. Explore the live model: GreenLeaf Wholesale on Metapad.
The heart of the operations layer is the order-fulfilment process itself. Every activity carries the numbers that turn a picture into something you can compute over:
The order-fulfilment process: eight steps from "receive order" to "handle backorders". The painful ones are visible in the attributes — manual order entry (~8 min, ~6% error, ~70% of ~9,000 orders/month), stock allocation on spreadsheets (~5% error), and a 22-minute backorder loop that exists only because an earlier step over-promised stock.
The Payoff: Decision-Grade Answers You Can Trace
A model is only worth building if you can ask it something that matters. So we did — on a model that was twenty minutes old.
- "Which activities are the biggest drag on our delivery time and reliability — and why?" The model traced the goal → the KPI that measures it → the process → the specific high-touch, high-error steps: manual order entry, stock allocation, picking, and the backorder loop. Not a guess — a walk along the relationships, weighing the numbers on each activity.
- "Which 2–3 steps should we fix first, and which scoped initiative does each one support?" Ranking the activities by volume × handling time × error rate put pick & pack first, then manual order entry, then stock allocation and backorders — and, because we had wired each initiative to the steps it targets, the model could tie each fix to its initiative structurally: order entry → the self-service portal; stock allocation and backorders → demand-driven replenishment; picking → the warehouse pilot. That is an answer following edges in the graph, not an AI improvising.
- "What are you least sure about? Where do the documents contradict each other or leave a gap?" This was the most senior-credible moment of the hour: the model told us what it *didn't* know — where the memo and the process notes disagreed, which numbers it had inferred rather than read. Those gaps are exactly the agenda a real transformation has to close.
None of that was the AI summarising a document. It reasoned over a typed model it had helped build — and gave answers you can trace to a node, challenge, and re-run tomorrow when the numbers change.
How This Differs From AI-on-Your-Documents — and Why You Want Both
It is tempting to think you could get the same thing by pointing a chatbot at your document folder. For the job of seeing how the enterprise connects, you can't — and that difference is the whole point.
AI on documents (RAG) | AI as co-modeller (what we built) |
|---|---|
Retrieves text, returns a plausible paragraph | Reasons over a typed knowledge graph it helped build |
An answer you have to take on faith | An answer you can **trace to a node** and challenge |
Static — re-ask, get more prose | Re-runnable — change a number, re-ask, get a new answer |
Running AI over your documents (a technique known as retrieval-augmented generation, or RAG) gives you a confident paragraph assembled from text it found. It cannot tell you which step drives which KPI, because that relationship was never written down in any one document — it only exists once you've connected them.
But this is not an argument against RAG — the two are complementary, and in practice you want both. The knowledge graph gives you the connected, structural view: how strategy, operations and measurement fit together, and answers you can trace. RAG over your documents gives you the depth: the ability to dive into a specific memo, contract or spec and pull out the detail behind a node. The graph tells you which document matters and why; RAG helps you read it closely. Used together, the model is the map and your documents stay the territory.
A computational knowledge graph gives you one shared, reliable view — for people and for AI. Everything else — the speed, the trust, the traceability — falls out of having a typed model on top of your documents, not just a pile of them.
The Vision: A Full-Stack Enterprise Digital Twin
Everything so far has been about structure — turning scattered documents into one connected model of how the enterprise runs. But documents are only half of what an enterprise already owns. The other half is its operational data: the order volumes, handling times, error rates and delivery numbers sitting in its data warehouses, its ERP and its operational systems — the real measurements, updated every day.
That data is everywhere too — and just as disconnected from the decision as the documents were. A warehouse holds the numbers, but it does not know which strategic goal they serve, which process they belong to, or who owns the step they describe. It can tell you order entry averaged 8.3 minutes last month; it cannot tell you that order entry is the activity dragging on the delivery-time goal that the self-service-portal initiative is meant to fix. That meaning lives in the model, not in the warehouse.
This is where the two halves meet. In the live build, the numbers on each activity — handling time, volume, error rate — we typed in by hand, from a one-page snapshot. The vision is to stop typing them: to let each node in the graph point at the data that actually measures it. Follow a thread down from a goal to an activity and, instead of stopping at a typed-in attribute, you keep going — drilling straight down into the warehouse rows behind it. The order-entry activity reads its handling time from the ERP; the delivery KPI reads its current value from the warehouse; the model stays current on its own.
When that happens, the computational knowledge graph stops being a model you build and refresh, and becomes a full-stack enterprise digital twin — a living, queryable layer over both halves of your information estate:
- the documents — the memos, contracts and specs that say why, who and should, reached through RAG;
- the operational data — the warehouses and systems that say *what actually happened*, reached through the same typed structure.
The graph is what makes both legible to a decision-maker: it is the map, and the documents and data are the territory. And because the structure is typed and computational, the same question we put to a twenty-minute-old model — which step is the real drag, and which initiative fixes it?— can be re-asked tomorrow against this morning's numbers, with no slide to rebuild.
Wiring the structure into the operational data already in your warehouses is what turns a model of your operating model into a digital twin of it — one that answers with this morning's numbers, not last quarter's deck.
To be clear, this is the direction of travel, not what we demonstrated: the live build shows you can stand up the structure in an afternoon; connecting it to live data is the work that follows. But the shape is already clear — and it is why we build on a platform designed for enterprise digital twins, not just for diagrams.
What's Next
The challenge we started with — an operating model that's everywhere and nowhere — is not solved by more documentation or more dashboards. It is solved by giving the enterprise one connected, typed, queryable model of how it runs, and keeping it alive. That is operating model engineering, and AI has made it dramatically faster to do.
Want to see it? The worked example is live and read-only — explore the GreenLeaf model on Metapad and follow the threads from goal to activity yourself.
Want to do this on your own operating model? That is exactly what our AI-Driven Operating Model Workshop is: the same workflow, your real documents, your people in the room, a full day. You leave with a working model of your operating model, a ranked list of what to fix first, and the gaps a real transformation needs to close.
Recent BlogpostsGo to blog overview
Recent Blogposts


Go to blog overview
Resources
All Rights Reserved.