
Sales & Operations Planning: When the Plan Falls Apart
Why disruptions aren't the problem and what our brewery simulation reveals about responsiveness
Sebastian Bitter
20.4.2026
Disruptions are not the problem. Missing structure turns a disruption into a problem. The same disruption can be a catastrophe or a non-event depending on market conditions. Context decides. The buffer that looks like waste without a disruption is often the only lifeline when one hits. S&OP creates visibility, decision-making capability and follow-through. These three things determine responsiveness.
1. It is April. The Brewery Has Stopped.
It is April. ElbeBräu Hamburg is brewing at full capacity. The World Cup is around the corner, demand for Elbe Pils is set to hit 7,500 hectolitres in June. Then the malt supplier reports: delivery failure. No malt for two months. Production: zero.
In our interactive brewery model, this is the MaterialShortage disruption. Three months of brewing time gone, three months before the warehouse feels it through the pipeline lag, three months before customers notice. By July, the safety stock is gone and the contract with NordGetränke starts breaking down.

MaterialShortage hits production from April to June. The Inventory & Demand chart shows the orange inventory line dropping off a cliff once the brewing pipeline empties. Service Level follows two months later as the safety stock runs out.
Or: month 7. A logistics strike halts deliveries to NordGetränke for two months. In the model, this is LogisticsStrike: the brewery keeps producing, but only 20 percent of monthly orders can be shipped. The result is paradoxical. The warehouse fills with unsold beer (production unchanged, but no outflow). Two months later, the stacked beer reaches its three-month shelf life and disposal spikes. The brewery has more inventory than ever and worse service level than ever.

LogisticsStrike blocks deliveries in July and August. The brewery keeps brewing, so inventory grows where a drop would be expected. Service Level collapses in parallel because nothing reaches the customer. Two months later, the Monthly Costs chart picks up the disposal spike as the stacked beer ages out.
Or: May to August. A heatwave compromises the cold chain. In the model, this is SpoilageCrisis: shelf life effectively halves, disposal doubles for four months. The brewery produces and delivers normally, but the warehouse bleeds.

SpoilageCrisis accelerates aging from May to August. Production and delivery look untouched in the Inventory & Demand chart, but the Disposal Cost line doubles for four months. The Cohort Aging chart shows it directly: the older cohorts disappear earlier than usual.
Three disruptions, three completely different failure modes. The only thing they have in common is that they hurt.
Disruptions are not the problem. Without structure and process, the disruption becomes the problem.
Behind the simple model: a more complex supply chain
Behind the simple brewery-wholesaler relationship in our simulation sits a more complex supply chain in reality. The simulation here keeps the network abstract to focus on the planning dynamics.
For readers who want to see the fan-out, we have built a separate Supply Chain Model in the Metapad library that makes suppliers, distribution channels and customer relationships explicit.
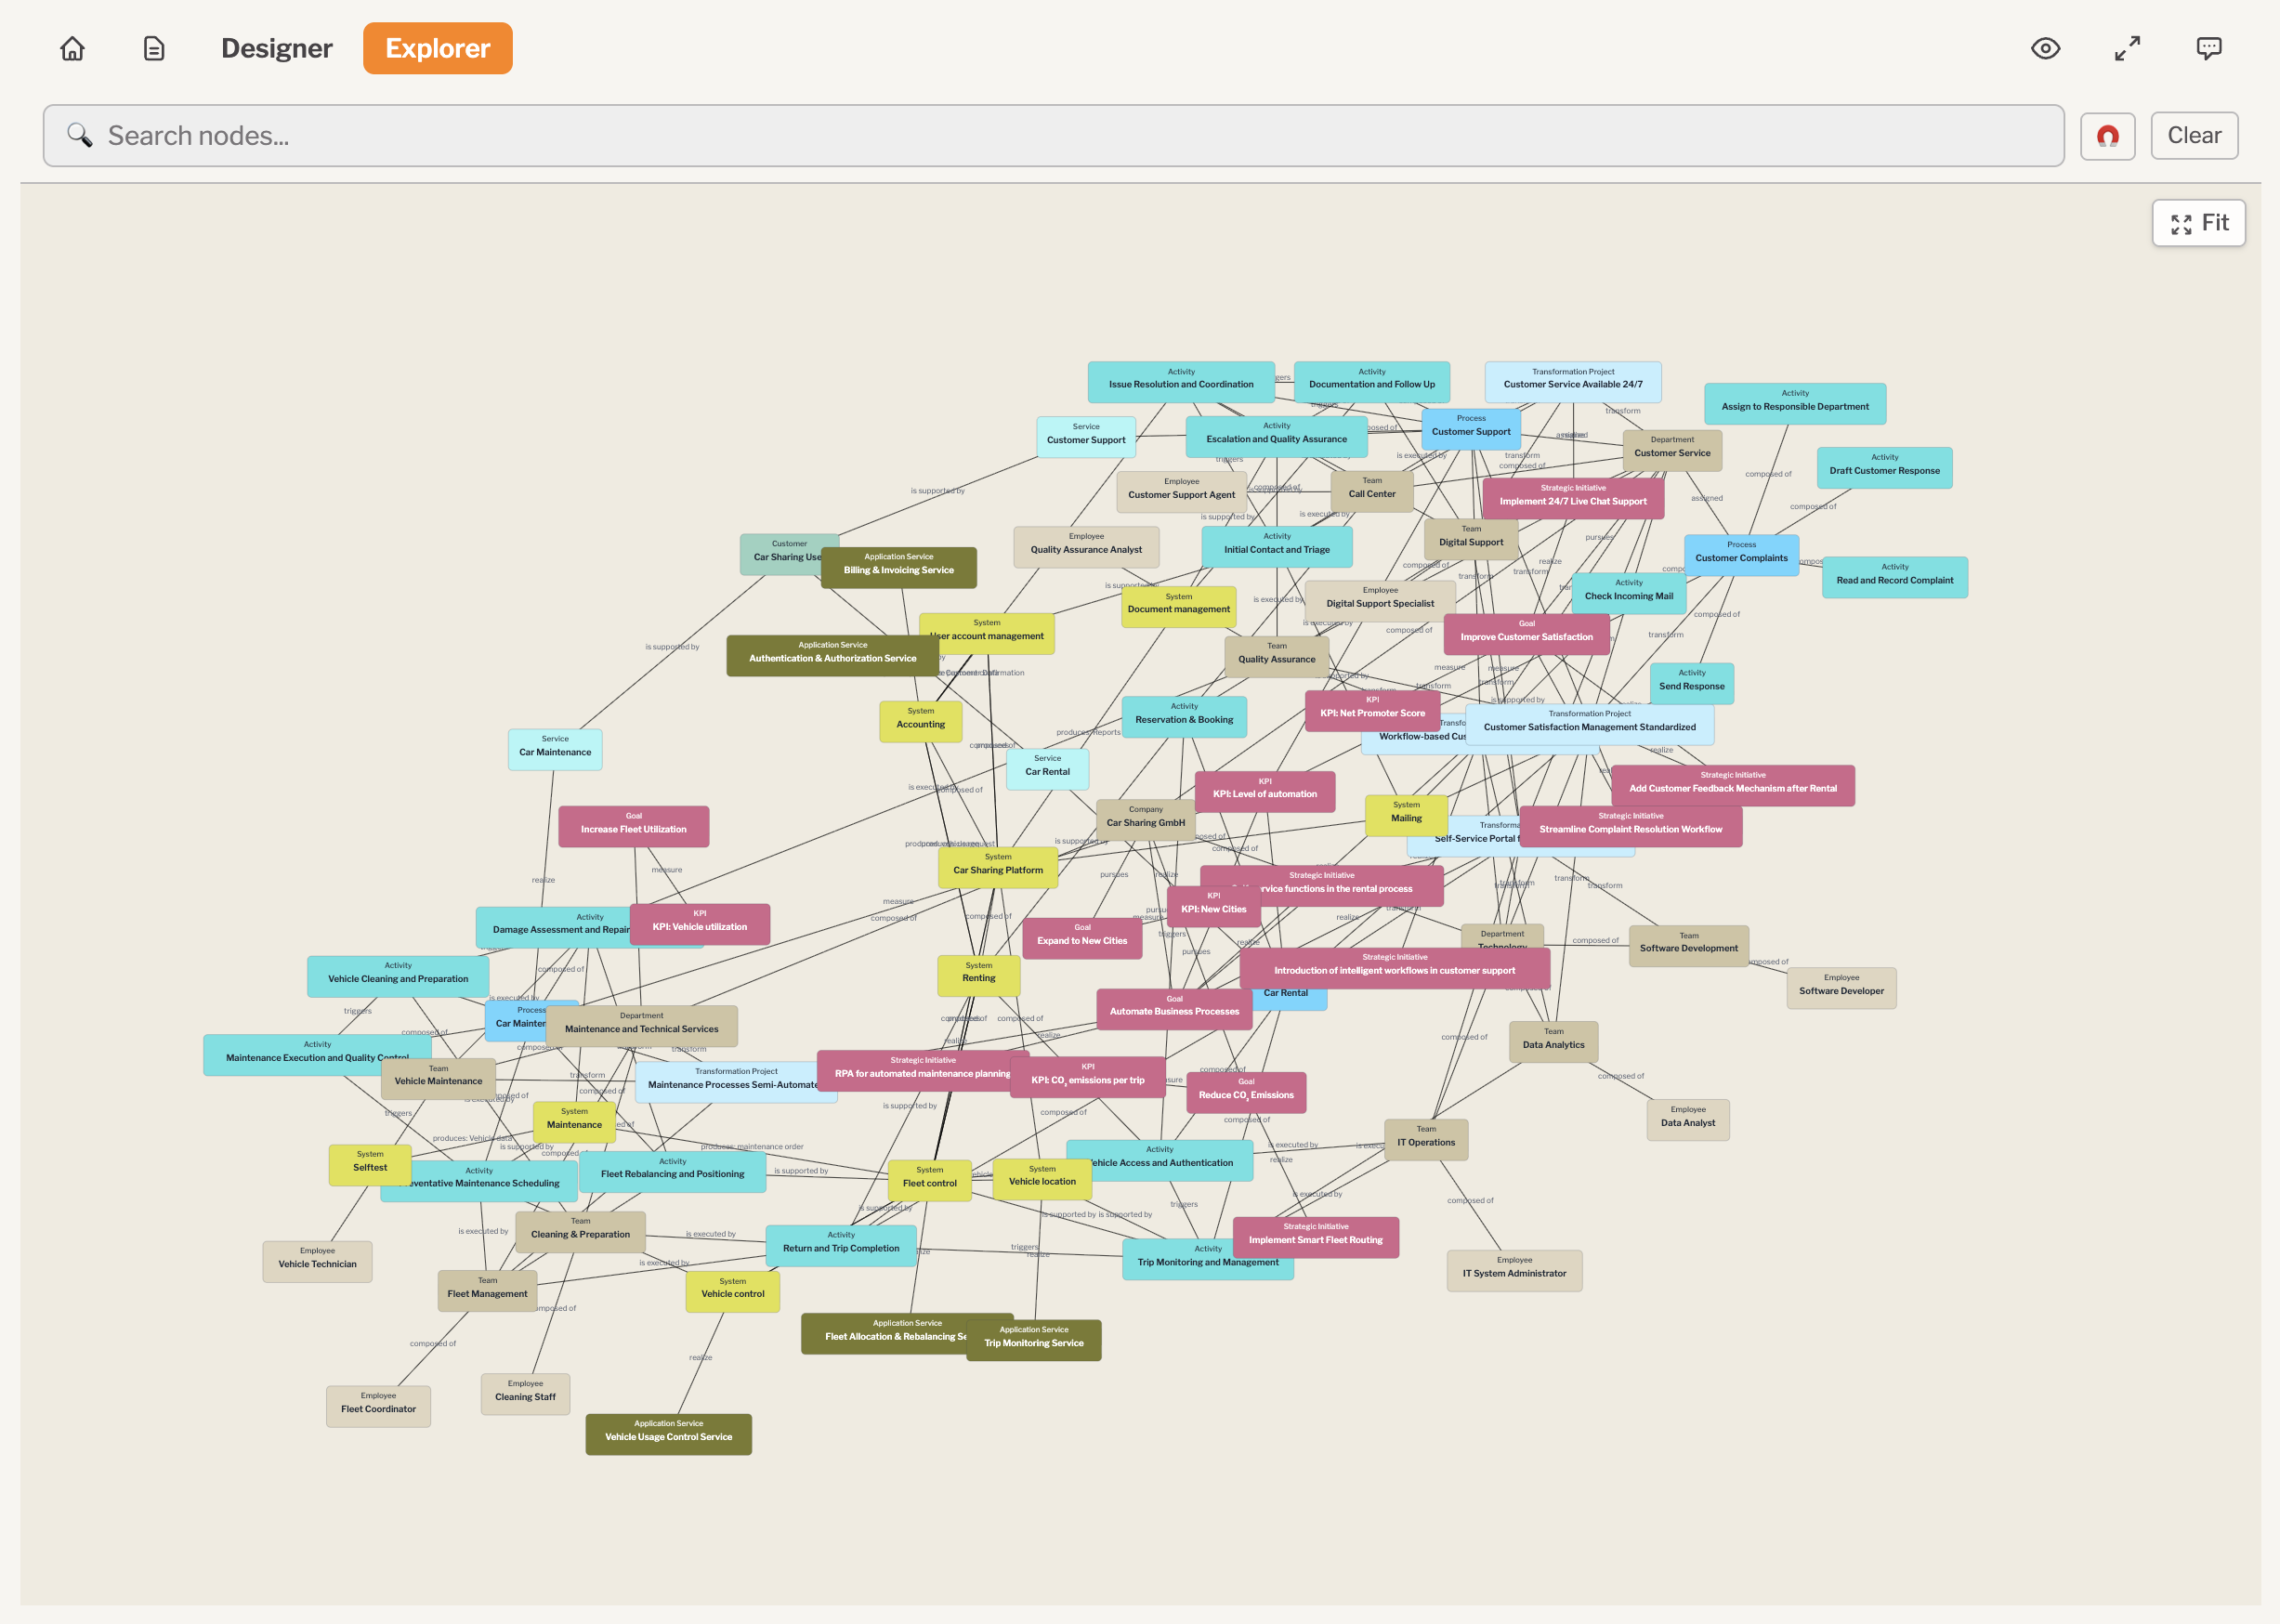
ElbeBräu Supply Chain

The ElbeBräu Hamburg supply chain in the Metapad model: from raw material suppliers through three distribution channels to wholesaler NordGetränke GmbH.
In our previous article Sales & Operations Planning: The Planning Matters More Than The Plan, we showed that no strategy wins every time. But what happens when a real disruption is added to that uncertainty?
2. Six Failure Modes, Three Mechanics
The model includes six different disruptions, but they do not all hit the brewery in the same way. They hit three different parts of the supply chain.
Mechanic | Disruptions | What gets blocked | Lag until visible |
Production | MaterialShortage, CapacityBlocked, SummerBlackout, HopShortage | Brewing output cut or stopped | 2 months (brewing pipeline) |
Delivery | LogisticsStrike | Shipment to customer blocked | Immediate (this month) |
Shelf Life | SpoilageCrisis | Aging accelerates, disposal doubles | Immediate (this month) |
Each mechanic leaves a different signature on the charts. Production-side disruptions drain the inventory two months after they hit. Delivery-side disruptions paradoxically grow the inventory while service collapses. Shelf-life disruptions shrink the inventory without affecting production or delivery directly. Three failure modes, three patterns to recognise.
This is the key takeaway for any S&OP team: a real disruption response cannot be "we will handle it the same way." The mechanic determines the response. Production loss means waiting out the pipeline, then catching up. Delivery loss means renegotiating with customers and watching shelf life. Shelf-life loss means accelerated write-offs and tighter inventory targets.
3. Same Disruption, Different Response
Let us imagine the same situation, a MaterialShortage in April, but once without and once with a functioning S&OP process.
Without S&OP:
ElbeBräu chose the TargetInventory strategy back in January. Good choice on paper: under normal seasonal conditions it sits in the middle of the pack and it builds buffer steadily. Then the material shortage hits. The safety stock lasts about three weeks. After that: stockouts. NordGetränke gets no Elbe Pils. With 20 percent customer churn per stockout period, customers permanently switch to competitors.
Nobody checked whether the strategy still fits. Nobody ran the numbers on the options. Nobody made a decision.
With S&OP:
In the April meeting, the material shortage becomes the top agenda item. The data is on the table:
- Current inventory: 2,500 hl
- Expected demand June (World Cup peak): 7,500 hl
- Production for 3 months: zero
- Window for action: now, before the pipeline empties
The team explores the options in the model. Switching to ForecastBased with a deliberately positive bias (+30%) creates an interesting effect: the brewery starts ordering as if demand would be 30 percent higher than expected. Without the disruption, that would be expensive overstocking. With the disruption coming, the over-built safety stock is exactly what is needed to ride it out.
This is the Saved by Bias pattern. The model makes it visible.

The same MaterialShortage scenario, comparing all five strategies in parallel. ForecastBased (orange) with a +30 percent bias pulls clearly ahead because the "bad" forecast accidentally builds the buffer that the disruption demands. The other strategies, including the otherwise solid TargetInventory (petrol), get hit hardest.
This is not rocket science. It is a meeting. But this meeting only happens if there is a process that forces it.
The simulation shows the same lesson under different worlds. With a market crash, ForecastBased loses its edge and Replenishment (which reacts directly to the dropping demand) wins. The right strategy is never fixed.

Under a Demand Crash scenario, the picture flips completely. Replenishment (sand) becomes the winner because it adapts directly to the shrinking demand. Strategies that ordered against last year's seasonal pattern (SeasonalNaive in light petrol, ForecastBased in orange) overproduce and pile up disposal costs.
Having a process that allows the brewery to recognise the disruption, evaluate the options and switch strategy in time is worth more than any single algorithm.
4. It is Not the Strategy That Saves You
If the model shows one thing, it is this: there is no strategy you can set once and forget. Each of the five strategies wins in one world and loses in another. The problem is not knowing the right strategy. The problem is having a process that ensures three things:
Visibility. Does everyone involved know what is happening? When the malt supplier fails, Procurement needs to know fast. So do Production and Sales. Fast information prevents a supply problem from becoming a customer problem.
Decision-making capability. Is there a framework for rapid response? The model shows five strategies, five worlds and four different winners. No algorithm makes this decision automatically. It takes people who understand the context and set priorities.
Follow-through. Is the decision actually implemented? A meeting without an outcome is not an S&OP meeting. If the April meeting decides to switch from TargetInventory to ForecastBased with a positive bias, Production needs to act on it the next day.
Systematic forecast bias is, by the way, like a disruption that happens every month. A −20 percent bias means 1,000 hl too few ordered every month. After 24 months: a 24,000 hl cumulative deficit. S&OP makes this bias visible, through the monthly comparison of forecast versus actuals, before it becomes a permanent problem.
The method matters less than whether someone regularly asks: does our plan still match reality?
5. Try It Yourself
Experiment 1: The MaterialShortage Test
Open the model. In the Sandbox view, set:
- Scenario: Seasonal
- Strategy: TargetInventory
- Disruption: MaterialShortage
Watch April through June: production drops to zero, the warehouse drains, July brings stockouts. Then switch the strategy to ForecastBased and push Forecast Bias to +30. The model rebuilds the run with the new strategy. Compare the service level and cumulative profit between the two runs.
Experiment 2: The Three Mechanics
Stay in the Sandbox. Strategy on Constant with production at 5,000. Switch the disruption dropdown between MaterialShortage, LogisticsStrike and SpoilageCrisis. Watch how each one leaves a different mark on the inventory line and the cost chart.
Experiment 3: The Comparison View
Switch to the Strategy Comparison view. Activate the parameter set saved_by_bias. You will see all five strategies running in parallel under MaterialShortage with +30 percent forecast bias. ForecastBased pulls ahead. Switch to demand_crash: now Replenishment wins. Same model, completely different winners depending on the world.
This is the central S&OP insight from the model: the right strategy depends on the world and the world keeps changing.

The Strategy Comparison view under MaterialShortage shows the bottom line of all five strategies at once. The Cumulative Profit chart (bottom right) makes the disruption response visible as a single number: who walks out of the year with the most money in the bank. The same MaterialShortage hits five different strategies with five different outcomes.
What is Next?
S&OP gives the framework for better decisions under uncertainty. But where exactly in the organisation does the response actually happen once the framework is in place? Who picks up the phone when the supplier fails? Who replans the production schedule when capacity is halved? Who tells the customer what they will and will not get?
In the next article: S&OP and Value Streams: Where in the Organisation Does the Response Happen?
Want to experience supply chain dynamics first-hand? In the Beergame you take on a role in the supply chain and experience the bullwhip effect for yourself.
Want to explore the structure behind S&OP? In our S&OP Process Model on Metapad you can navigate the metamodel from Data Review to Executive S&OP and see how Reviews, Plans, KPIs and Action Items connect. Learn more about Metapad.


Resources
All Rights Reserved.