
Sales & Operations Planning: When the Plan Falls Apart
Why disruptions aren't the problem and what our brewery simulation reveals about responsiveness
Sebastian Bitter
20.4.2026
Material shortage, logistics strike, production outage: disruptions hit every supply chain. Our simulation shows that it's not the disruption that matters, but whether there's a process behind it.
It's April. The Brewery Has Stopped
It's April. ElbeBräu Hamburg is brewing at full capacity. The World Cup is around the corner, and demand for Elbe Pils is set to hit 7,500 hectolitres in June. Then EuroMalt BV reports: delivery failure. No malt for two months. Production: zero.
In our S & OP simulation, this is the "material shortage". The numbers are brutal: anyone running with tight safety stock loses €766,700 in stockout costs in just two months. Anyone who happened to have high inventory survives.
Or: month 11. PolFreight Logistics goes on strike. Everything ElbeBräu ordered from HopMaster Polska and YeastSupply NL arrives two months late. In the simulation, that means the effective lead time jumps from 2 to 4 months. On average, this costs €672,000, the highest impact of all disruptions.
The numbers from the simulation become more concrete when you know who's behind them. That's why we built a Supply Chain model in Metapad that brings the theory from the simulation to life with real examples.
ElbeBräu Hamburg sources barley malt from EuroMalt BV and AgroTrans Malz KG, hops from HopMaster Polska, yeast from YeastSupply NL and YeastPro Polska. Three distribution channels move raw materials to the brewery, and at the end of the flow stands NordGetränke GmbH as wholesaler. Every node in this network has a name. Every one can become a bottleneck.
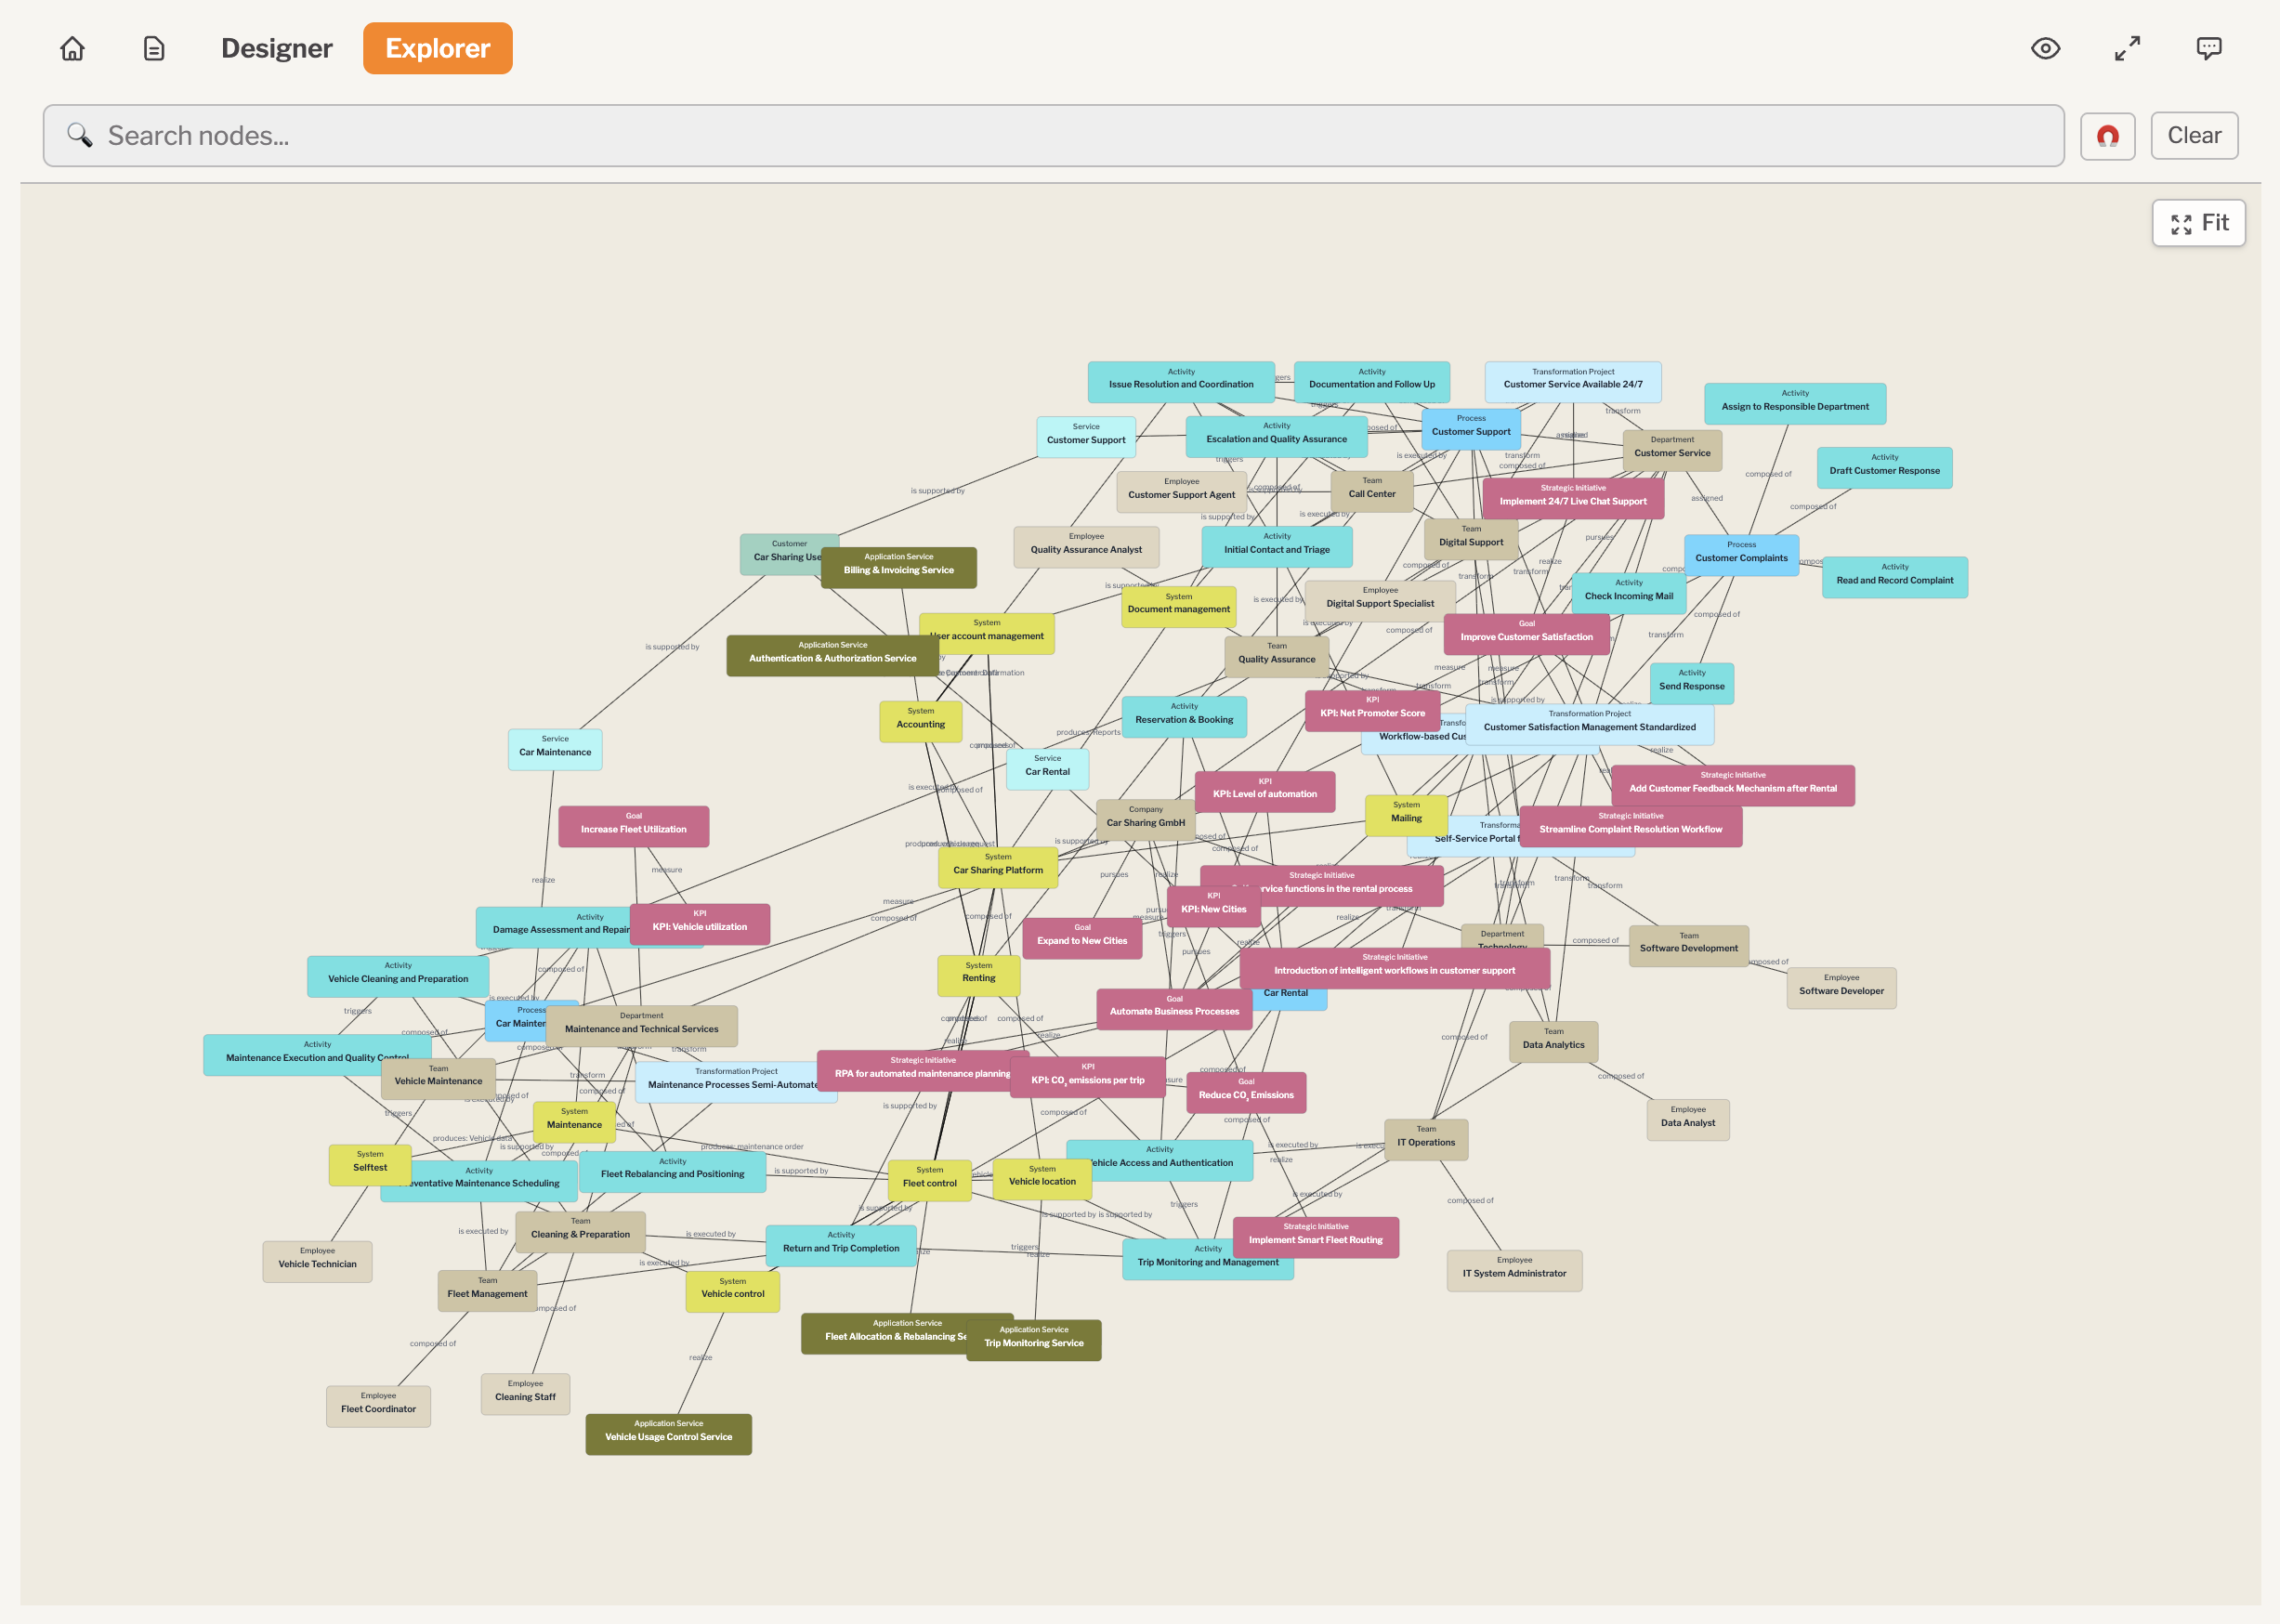
ElbeBräu Supply Chain

The ElbeBräu Hamburg supply chain in the Metapad model: from raw material suppliers through three distribution channels to wholesaler NordGetränke GmbH.
In our previous article Sales & Operations Planning: The Planning Matters More Than The Plan, we showed that no strategy wins every time. But what happens when a real disruption is added to that uncertainty?
Disruptions on their own aren't the problem. But without structure and process, the disruption becomes the problem.
The Simulation Under Shock
Our simulation tests 42 combinations: 6 demand scenarios × 7 disruptions. The results reveal patterns that are surprising at first glance.
The Material Shortage: When the Buffer Becomes the Hero
Months 4 and 5, right in the middle of World Cup preparation: production drops to zero. No exceptions, no workarounds. Nothing comes out of the brewery for two months.
What happens to the different strategies?
Strategy | Service Level | Stockout Cost | Result |
|---|---|---|---|
Constant | 100% | €0 | Survives. An accidental overstock of ~10,000 hl acts as a buffer |
Target Inventory | 93.6% | €766,700 | Collapses. Only ~2,333 hl of safety stock isn't enough |
This is the Buffer Paradox: what counts as waste without a disruption, namely high inventory from a constant order quantity, becomes a lifesaving buffer when a disruption hits. The "dumb" strategy survives, the "smart" one doesn't.
Fulfillment & Disposal Material Shortage
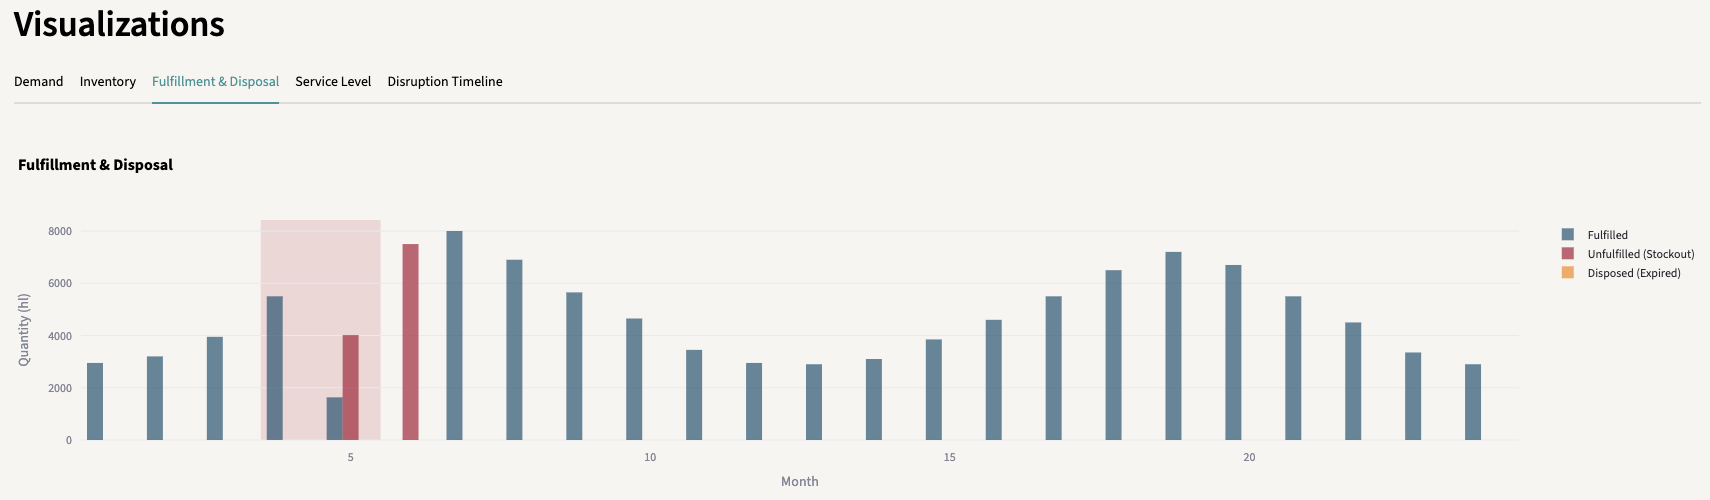
Seasonal, material shortage months 4-5: the red-highlighted months show the production outage. Under Target Inventory, fulfillment collapses (blue bars shrink), and the red bars show unfulfilled demand. From month 6, delivery capability recovers. Try the simulation
But be careful: this doesn't mean Constant is the better strategy. Without disruptions, Constant permanently pays higher holding costs and loses product to disposal during seasonal demand. The buffer is coincidence, not design.
The Logistics Strike: When Lead Time Doubles
Months 11 to 14: PolFreight Logistics and NL Trans Freight go on strike. Everything in transit is delayed by two months. The effective lead time jumps from 2 to 4 months.
This is the most insidious disruption. It doesn't affect production itself but the pipeline. Everything ElbeBräu ordered in recent weeks is stuck. The brewery keeps producing, but the materials don't arrive.
On average, the logistics strike costs €672,000. But the impact varies dramatically depending on the scenario:
- Growing market + logistics strike: -€4.2M (catastrophe: demand rises, materials don't arrive)
- Shrinking market + logistics strike: nearly neutral (lower demand compensates for the delay)
This is why context is everything. The same disruption can be a catastrophe or a non-event, depending on what's happening in the market at the same time.
Anyone already operating with a negative forecast bias, systematically ordering too little, gets hit twice: less ordered and later delivered. The slightly positive bias (+10%) that we described as surprisingly effective in the previous article acts as implicit insurance here: the resulting overstock absorbs the delay.
Inventory during Logistics Strike
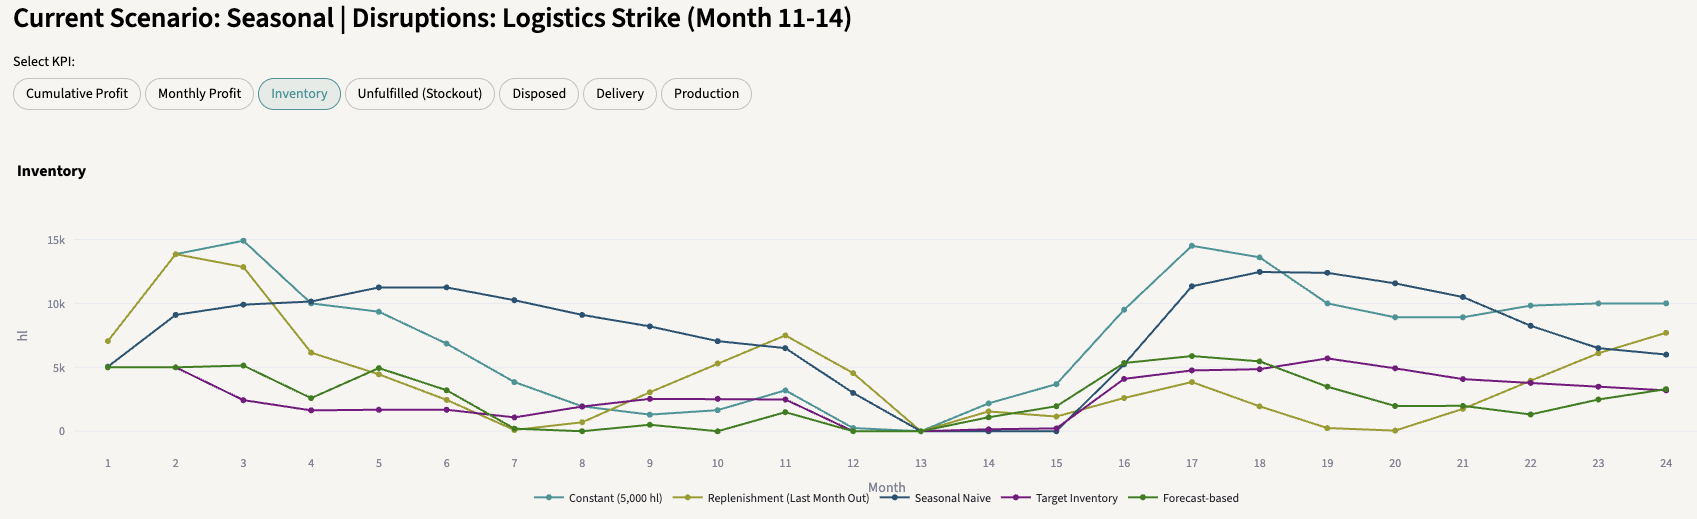
Seasonal, logistics strike months 11-14: all strategies lose inventory during the strike. The difference shows in the recovery: Constant (teal) builds up massive stock from month 15 as delayed deliveries arrive in bulk. Strategies without a buffer remain at low levels for longer. Try the simulation
The Surprising Finding: Disruptions Can Have a Positive Effect
This sounds counterintuitive, but the simulation shows it clearly:
Disruption | Avg. Impact | Best Case |
|---|---|---|
Material shortage | +€268,000 | Demand crash: €2.1 Mio. |
Hop shortage | +€500,000 | Demand crash: +€1.2 Mio. |
In shrinking markets or during a demand crash, a production stop can prevent overproduction. Less production → less inventory build-up → less spoilage → higher profit.
Disruptions aren't automatically bad. With perishable goods, a production pause during a demand downturn can be more profitable than unchecked production.
The problem: this insight only helps if someone has it in real time. And that's exactly where the difference between "having a disruption" and "managing a disruption" becomes visible.
Strategy Comparison Cumulative Profit Material Shortage
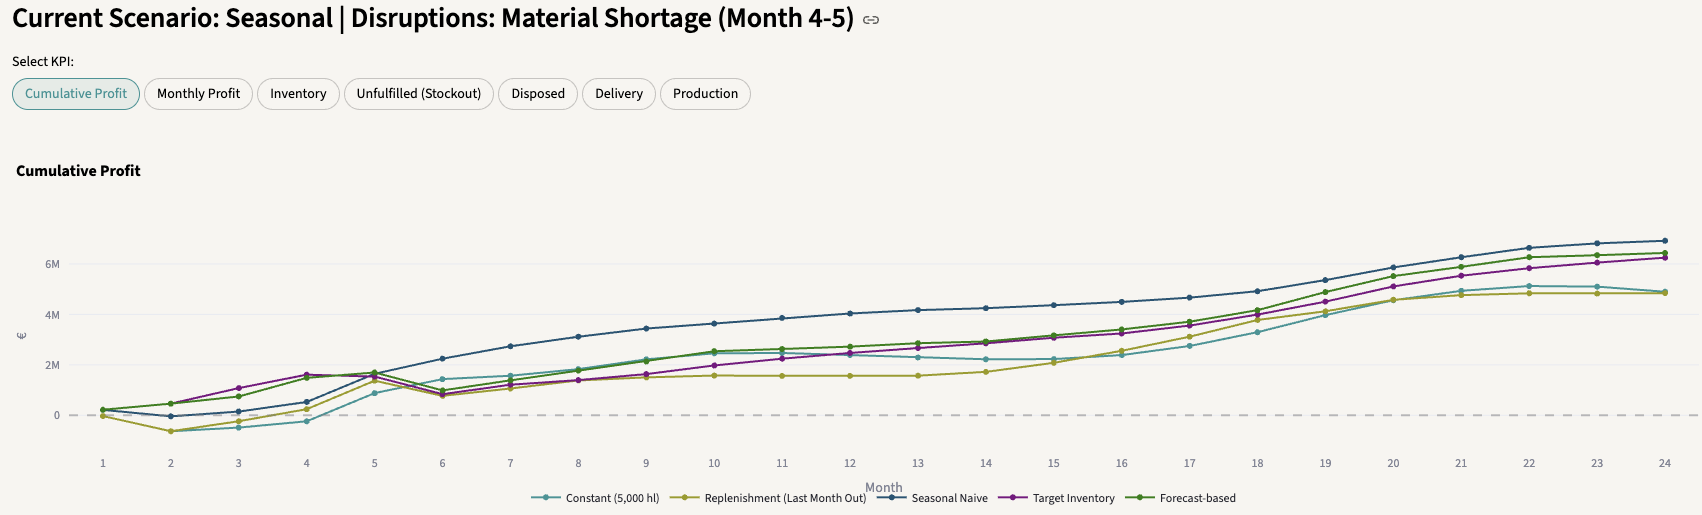
Seasonal, material shortage months 4-5: cumulative profit of all five strategies over 24 months. Constant (teal) pulls ahead early through its accidental buffer. The other strategies recover, but the gap remains. Try the simulation.
Same Disruption, Different Response
Let's imagine the same situation, a material shortage in April, but once without and once with a functioning S&OP process.
Without S&OP
ElbeBräu chose the "Target Inventory" strategy back in January. Good choice: it wins in 40% of all scenarios. Then the material shortage hits. The safety stock of 2,333 hl lasts about three weeks. After that: stockouts. NordGetränke GmbH gets no Elbe Pils. With 10% customer churn per stockout period, customers permanently switch to competitors.
Nobody checked whether the strategy still fits. Nobody ran the numbers on the options. Nobody made a decision.
With S&OP
In the April meeting, the material shortage becomes the top agenda item. The data is on the table:
- Current inventory: 2,333 hl
- Expected demand June (World Cup peak): 7,500 hl
- Production for 2 months: zero
- Window for action: now
The decision: switch to Constant immediately, maximum production as soon as material is available again, even if holding costs rise in the short term. At the same time, Sales informs NordGetränke GmbH about potential shortages and prioritizes Elbe Pils over Elbe Hell and Elbe Dunkel.
This isn't rocket science. It's a meeting. But this meeting only happens if there's a process that forces it.
The simulation shows this in numbers: the winner matrix shifts with nearly every disruption. With Seasonal + Material Shortage, Seasonal Naive wins. With Seasonal + Logistics Strike, Target Inventory wins. With Steady State, Constant wins in 6 out of 7 disruptions. Having a process that enables these switches saves €300,000 to €700,000 per disruption event on average.
It's Not the Strategy That Saves You
If the simulation shows one thing, it's this: there is no strategy you can set once and forget. 42 combinations, in almost every one a different strategy is optimal.
The problem isn't knowing the right strategy. The problem is having a process that ensures three things:
- Visibility: Does everyone involved know what's happening? When PolFreight goes on strike, it's not just Procurement that needs to know, but also Production and Sales. Fast information prevents a supply problem from becoming a customer problem.
- Decision-making capability: Is there a framework for rapid response? The simulation shows 42 combinations with different winners. No algorithm makes this decision automatically. It takes people who understand context and set priorities.
- Follow-through: Is the decision actually implemented? A meeting without an outcome isn't an S&OP meeting. If the April meeting decides to prioritize Elbe Pils, Production needs to replan the next day.
Systematic forecast bias is, by the way, like a disruption that happens every month. -20% bias means: 1,000 hl too few ordered every month. After 24 months: a 24,000 hl cumulative deficit. S&OP makes this bias visible, through the monthly comparison of forecast versus actuals, before it becomes a permanent problem.
It's not the method that determines success, but whether someone regularly asks: does our plan still match reality?
From Framework to Execution
S&OP provides the framework: regular alignment, a shared data foundation, structured decisions. But who executes?
When EuroMalt BV fails, Procurement must react: activate alternative suppliers, contact AgroTrans Malz KG, evaluate substitutes. When capacity is halved, Production must replan: which product has priority? Elbe Pils for the World Cup or Elbe Dunkel for the loyal customer? When NordGetränke GmbH is undersupplied, Sales must prioritize: who gets what?
These are the operational capabilities that translate an S&OP decision into reality. In the ElbeBräu supply chain, you can see this in our supply chain model on Metapad: every node, whether Supplier, Distribution Channel, or Manufacturer, has its own responsibilities and options for action.
In the next article, we will look at how these operational capabilities work together with S&OP as value streams.
Try It Yourself
Experiment: The Logistics Strike
Open the simulation. Set:
- Scenario: Seasonal
- Strategy: Replenishment
- Disruption: Logistics Strike
Watch months 13-14: deliveries stall, inventory empties out. Then switch to Target Inventory. The safety stock and WIP awareness absorb the strike. The profit difference: over €500,000.
Then test: same settings, but Scenario: Shrinking. Suddenly the logistics strike barely matters. Context decides.
What's Next?
S&OP provides the framework for better decisions under uncertainty. But where exactly in the organisation does the response happen once the framework is in place? Procurement, Production, Logistics are the value streams that translate an S&OP decision into results.
In the next article: S&OP and Value Streams: Where in the Organisation Does the Response Happen?
Table of Contents


All Rights Reserved.